


Bigdesk is a tool to look into various JVM and operating-system level metrics about your cluster. If your cluster runs slowly or experiences unusual errors, Bigdesk is a good place to check for anything out of the ordinary.
After following the installation instructions from the previous chapter, access Bigdesk by visiting http://elasticsearch-node-01:9200/plugin/bigdesk/. The initial landing page looks like this:

Like Elasticsearch-head, this page shows the nodes in your cluster and the cluster health. Click on any of the nodes listed in the top row to display its individual metrics:
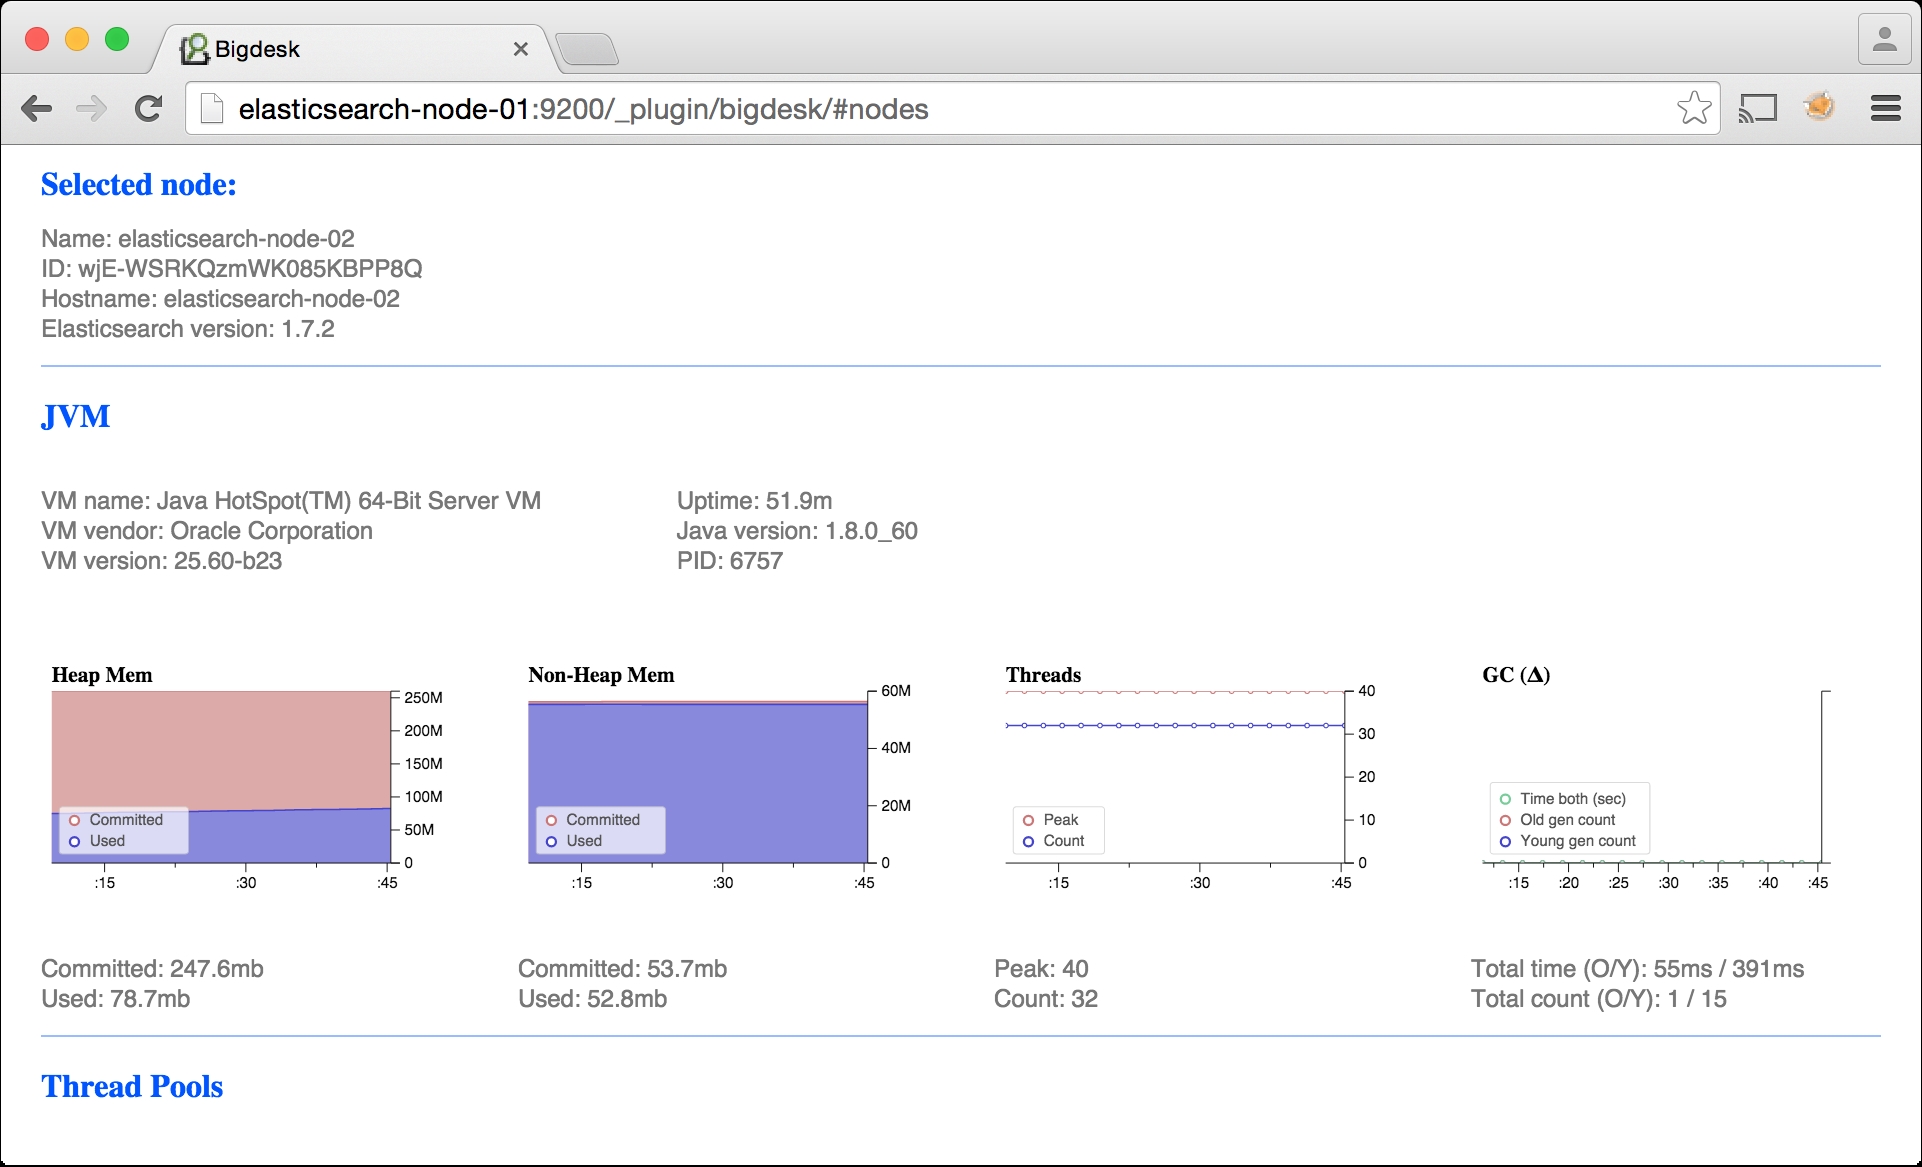
In this screenshot, we selected elasticsearch-node-02 and are looking at JVM metrics. A notable chart in this section is the Heap Mem figure. If you are using close to the maximum amount of committed heap memory, you will want to increase your heap memory by setting ES_HEAP_SIZE to at the most half of your total available memory.
Further down, we see operating system metrics, namely:
CPU usage
Memory usage...


