After exploring Elasticsearch and Logstash, it's time for Kibana, which provides us with an interface to visualize the data we collect and store. In this chapter, we will focus on the Kibana interface, providing all the important details. We will also learn about Lucene query searches, aggregations, and so on, and understand the role they play.
At the end of this chapter, you will understand the new features of Kibana, the functionality of various tabs and their components along with how to create visualizations, dashboards, and customize Kibana settings. Also you will understand how to insert data into Elasticsearch, create an index pattern, and visualize the data, followed by how to create dashboards and share and embed them.
In this chapter, we will cover the following sections:
Kibana and its offerings
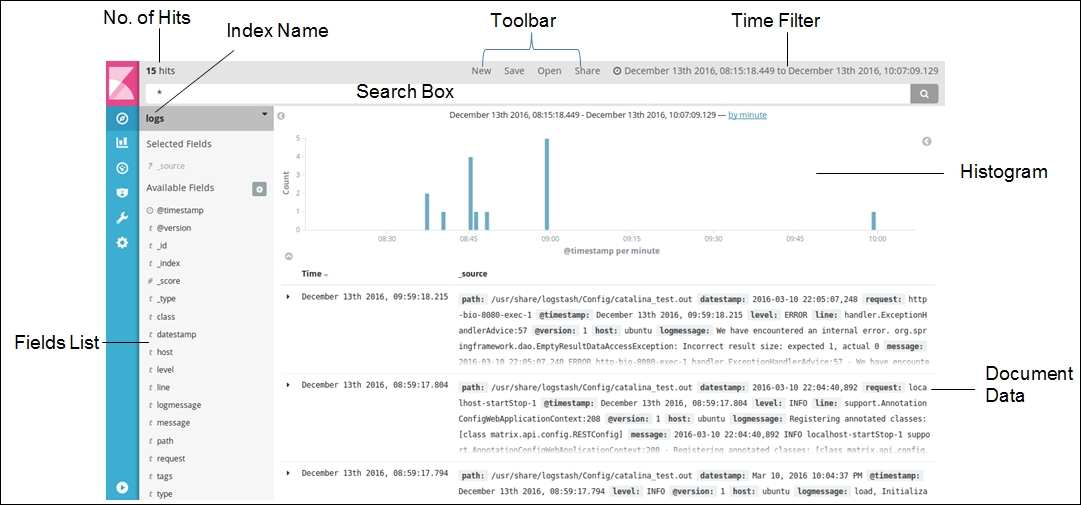
Exploring the discover interface
Querying and searching data
Exploring the visualize interface
Understanding aggregations
Exploring the dashboard interface
Understanding...