Search icon
Arrow left icon
All Products
Best Sellers
New Releases
Books
Videos
Audiobooks
Learning Hub
Newsletters
Free Learning
Arrow right icon
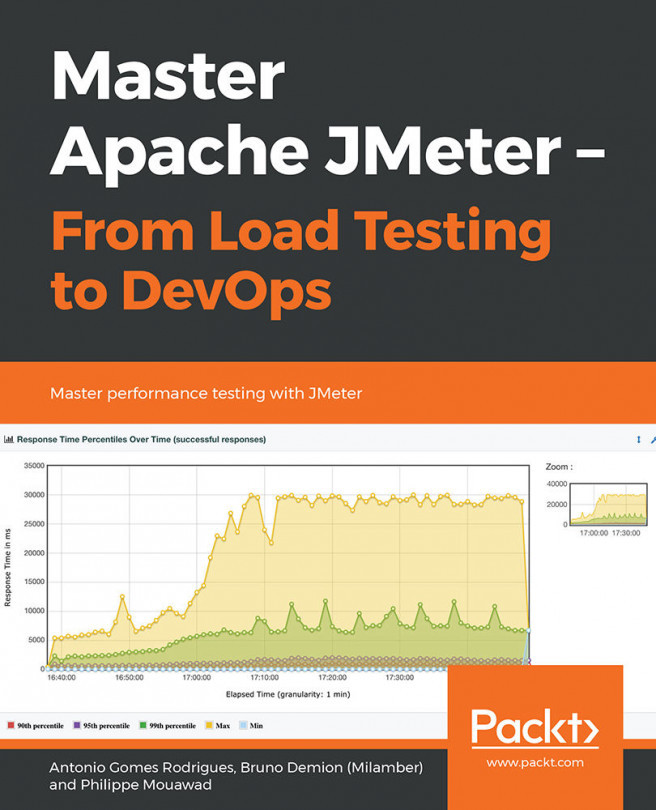
Master Apache JMeter - From Load Testing to DevOps

Master Apache JMeter - From Load Testing to DevOps: Master performance testing with JMeter

By Antonio Gomes Rodrigues , Bruno Demion (Milamber) , Philippe Mouawad
$27.99 $18.99
Book Aug 2019 468 pages 1st Edition
eBook
$27.99 $18.99
Print
$44.99
Subscription
$15.99 Monthly
eBook
$27.99 $18.99
Print
$44.99
Subscription
$15.99 Monthly

What do you get with eBook?

Product feature icon Instant access to your Digital eBook purchase
Product feature icon Download this book in EPUB and PDF formats
Product feature icon Access this title in our online reader with advanced features
Product feature icon DRM FREE - Read whenever, wherever and however you want
Buy Now

Product Details


Publication date : Aug 1, 2019
Length 468 pages
Edition : 1st Edition
Language : English
ISBN-13 : 9781839217647
Vendor :
Apache
Category :
Languages :
Table of content icon View table of contents Preview book icon Preview Book

Master Apache JMeter - From Load Testing to DevOps

Quick Start with JMeter

With JMeter, you can quickly run your first load test. This chapter will show you how to set up a simple test case with JMeter and its HTTP(S) Test Script Recorder element.

Our Process

Here are the steps to set up our test:

  1. Launch JMeter and prepare the recording of our script
  2. Configure the browser to use the HTTP(S) Test Script Recorder of JMeter
  3. Record the script
  4. Customize our script (add assertions, rename transactions, add think time…)
  5. Validate our script with a single user
  6. Configure the load test (define the number of users, number of iterations, warm-up duration, and load test duration…)
  7. Run and analyze the load test

Setup JMeter to Record Our Browsing Session

  1. Launch JMeter:
    Figure 1.1: JMeter
    Figure 1.1: JMeter
  2. Use the Templates… feature of JMeter:
    Figure 1.2: JMeter Templates… feature
    Figure 1.2: JMeter Templates… feature
  3. Choose Recording with Think Time model and click Create:
    Figure 1.3: Recording template
    Figure 1.3: Recording template
  4. The test plan is ready:
    Figure 1.4: Result of Recording template
    Figure 1.4: Result of Recording template
  5. To save time in the future, we will select the HTTP Request Defaults element and fill in the Server Name or IP and Port Number sections:
    Figure 1.5: Result of Recording template
    Figure 1.5: Result of Recording template

    Note

    With this trick, we will share these two fields in every element HTTP Request Defaults and JMeter will not put them in each HTTP Request during recording.

    Caution

    During the load test, you should avoid having the injector (JMeter) on the same server as the application under test.

    Otherwise, the injected load will be impacted by the application's bad performance, and the application could be impacted by the injector's bad performance.

    Our tree is ready; we must now start the proxy server of JMeter.

    But before doing that, let's look at the HTTP(S) Test Script Recorder element.

  6. For the name of recorded transactions, we have two options in Recorder:

    Transaction name, which allows you to fully name them as you wish.

    Prefix, which will just prepend the prefix to the default name given by JMeter, which is usually the URL path.

    Figure 1.6: Transaction naming strategy
    Figure 1.6: Transaction naming strategy
  7. Note that with the default configuration of the template, static resources (image, CSS file, JS file…) are not recorded:
Figure 1.7: Exclude static resource capture

JMeter is now ready to record our navigation session.

Configure Your Browser

  1. In order for JMeter to record the navigation session, we must configure our browser to use the proxy server that JMeter launched.
  2. For example, with Firefox, choose the menu Edit > Preferences:
    Figure 1.8: Proxy selection in Firefox
    Figure 1.8: Proxy selection in Firefox
  3. Then select the Advanced tab and then the Network sub-tab. Let's click on Settings…:
    Figure 1.9: Proxy selection in Firefox – Network
    Figure 1.9: Proxy selection in Firefox – Network
  4. In the new window, select the Manual proxy configuration option, then fill in the HTTP Proxy field with the following IP address: 127.0.0.1 (corresponding to the local IP address (localhost)), and fill in the Port field with 8888 (corresponding to the default listening port of the JMeter proxy server).

    Caution

    When recording a local application, be careful to delete localhost and 127.0.0.1 from the No Proxy for: field.

  5. Finally, check the Use this proxy server for all protocols box.
  6. Let's save the modifications by clicking on the OK button in the Firefox window:
Figure 1.10: Proxy selection in Firefox – configuration

Save Our Script

Now, let's start our navigation session.

  1. To do this, simply click the Start button on the HTTP(S) Test Script Recorder element:
    Figure 1.11: HTTP(S) Test Script Recorder
    Figure 1.11: HTTP(S) Test Script Recorder

    Note

    Note that the default listening port of JMeter proxy server is 8888.

    Note the first time you start the recorder, it takes more time as it generates a Certificate Authority that you can use to intercept HTTPS traffic.

  2. This will open a Recorder: Transactions Control window, allowing us to set in real time the name of each recorded step transactions and their grouping based on time:
    Figure 1.12: Recorder: Transactions Control
    Figure 1.12: Recorder: Transactions Control
  3. In this chapter, we will use the Request Parameters example delivered with Apache Tomcat.

    From the browser, navigate to the website:

    http://server:8080/examples/servlets/

    In our case, it will be:

    http://localhost:8080/examples/servlets/

    Here is the first page:

    Figure 1.13: First page of our scenario
    Figure 1.13: First page of our scenario
  4. Then, click on the Execute link of the Required test servlet:
    Figure 1.14: Request Parameters Example with no entries
    Figure 1.14: Request Parameters Example with no entries

    Enter first and last name and click on Submit Query:

    Figure 1.15: Request Parameters Example before submitting query
    Figure 1.15: Request Parameters Example before submitting query

    When the result appears, we can stop our navigation session:

    Figure 1.16: Request Parameters Example after submitting query
    Figure 1.16: Request Parameters Example after submitting query
  5. In JMeter, the scenario tree is the following:
    Figure 1.17: Result of our recording in JMeter
    Figure 1.17: Result of our recording in JMeter
  6. Let us observe what has been recorded:
    Figure 1.18: Observation table
  7. As we can see, thanks to the trick of filling the Server Name or IP and Port Number sections of the HTTP Request Defaults element, these fields remain empty in the HTTP Request elements.

    This will allow us to change the URL and port of the tested site in only one location (HTTP Request Defaults) if necessary (for example, if the script was run on a development environment, and the final test will run on the pre-production environment):

    Figure 1.19: Result of filling in the Server Name or IP and Port Number sections of the HTTP Request Defaults element
    Figure 1.19: Result of filling in the Server Name or IP and Port Number sections of the HTTP Request Defaults element
  8. Similarly, the waiting time between each action (Think time) was recorded:
    Figure 1.20: Recorded think time
    Figure 1.20: Recorded think time
  9. To make it easier to read the results, it is preferable to rename HTTP requests. The automatically chosen name, by default, corresponds to the called URI, but you can control it in the little popup and give it a meaningful name before clicking on the button that will issue the request(s).

    The result of the renaming:

    Figure 1.21: Renaming result
    Figure 1.21: Renaming result
  10. As the last step to the development of the scenario, we are going to add assertions to each HTTP request. These will make it possible to verify that the response received is indeed the expected one.
  11. To do this, select the HTTP request that will receive the assertion, then, via the context menu, choose Add > Assertions > Response Assertion:
    Figure 1.22: Add assertion
    Figure 1.22: Add assertion
  12. A new Response Assertion element has been added as a child to the SC01_1 Homepage request.
  13. Let's select the following options:

    Field to Test: Text Response

    Pattern Matching Rules: Substring (default)

    Patterns to Test: Let's click on the Add button, then insert text contained in the answer:

    Figure 1.23: Assertion configuration
    Figure 1.23: Assertion configuration
  14. To find what data we need to check in response, the trick is to use the View Results Tree element, located under our HTTP(S) Test Script Recorder, by choosing the desired request and then by selecting the tab Response data > Response Body.
  15. We can then copy the text and use Add from clipboard button in the Response Assertion:
    Figure 1.24: Result in Results Tree
    Figure 1.24: Result in Results Tree
  16. Repeat the operation for all the requests in the same way as you did for the home page.

    In the end, we get this JMeter scenario tree:

Figure 1.25: Our JMeter scenario

Now our scenario is ready, let's proceed to the validation of our script.

Validate Our Script with Only One User

  1. It's easy with the validation mode, as it allows us to execute our script with only one user, one iteration, and without pause time.
  2. To do this, let's select the Thread Group that we want to test, right-click, and select Validate:
    Figure 1.26: Validation of our script
    Figure 1.26: Validation of our script
  3. Validate in the View Results Tree element that all Sample Results are green. If that is the case, we can proceed to the configuration step of our load test.

Setup Our Load Test and Launch It

  1. To set up our load test, select the Thread Group element in order to change the following values:

    Number of Threads (users): 10

    Ramp-Up Period (in seconds): 10

    Loop Count: 100

    This gives 10 virtual users (VU) who arrive in 10 seconds (1 per second), and each one will make 100 executions of the query sequence.

    Figure 1.27: Load test parameters
    Figure 1.27: Load test parameters

    Caution

    Several strategies for setting the load test exists. This point will be discussed deeply in Chapter 2, JMeter Overview.

  2. We could run our load test directly from the JMeter GUI, but this is not recommended as it would not be optimal for performances of injection (although, in our case, with only 10 users, it shouldn't be a problem).
  3. When load testing, it is advisable to monitor the injectors (servers where JMeter runs) at least during the first test at full load to validate the correct behavior of the injectors.

    This ensures that if we get bad response times, the cause is the application being tested and not JMeter.

    Note that this is not specific to JMeter but should be done regardless of the tool you use.

    Note

    An easy and quick solution to monitor JMeter can be to use the Servers Performance Monitoring plugin from the JMeter Plugins (https://jmeter-plugins.org/wiki/PerfMon/).

  4. So, let's use best practices directly and run our test from the command line in CLI mode (also called Non-GUI mode in JMeter).
  5. But before that, to follow our test in real time, we will add the Backend Listener element to enable live monitoring of the progress of the test with Grafana (https://grafana.com/).
  6. To do this, right-click on Test Plan -> Add -> Listener -> Backend Listener:
    Figure 1.28: Add Backend Listener
    Figure 1.28: Add Backend Listener
  7. Let's configure it to send the test results to our InfluxDB database (https://www.influxdata.com/):
Figure 1.29: Backend Listener configuration

Note

In the samplersRegex field, we can use a regular expression to keep only the queries that were recorded by the HTTP(S) Test Script Recorder element (thanks to Prefix: field).

Run Our Load Test and Analyze It

  1. Before launching our test, one last tip is to ask JMeter to generate an HTML report at the end.

    For this, we will use the following command line:

    <JMETER_HOME>/bin/jmeter -n -t [jmx file] -l [results file] -e -o [Path\ to output folder]

  2. Let's run our test and see what happens.

    In our terminal:

    Figure 1.30: Follows a load test in the terminal
    Figure 1.30: Follows a load test in the terminal
  3. In Grafana (the dashboard used is one of those proposed in the Grafana website (https://grafana.com/dashboards/3351)):

    Note

    We can use this dashboard, too: https://grafana.com/dashboards/5496.

    Figure 1.31: Real-time monitoring in Grafana
    Figure 1.31: Real-time monitoring in Grafana
    Figure 1.32: Real-time monitoring in Grafana
    Figure 1.32: Real-time monitoring in Grafana
  4. At the end of our test, we get the HTML dynamic Web Report with 17 graphs, an APDEX (https://en.wikipedia.org/wiki/Apdex) table, a statistics table (showing response times, error rates, network metrics…), a table with an errors summary, and a table with Top5errors per sampler. So, you get everything you need to analyze your load test:
Figure 1.33: HTML report
Figure 1.34: HTML report

The icing on the cake is a CSV file we get at the end of our test; this format is usable by many tools to visualize the results differently.

In this chapter, we have seen how to quickly get started with JMeter to perform a simple load test.

Left arrow icon Right arrow icon

Key benefits

  • Gain insights into preparing test environments and selecting the correct use cases to load test
  • Learn to analyze a load test with Backend Listener, HTML Report Dashboard, and View Results Tree
  • Explore how to integrate JMeter in the software factory

Description

Load tests help identify the maximum number of requests a software system can handle. One popular open source tool for load testing is JMeter. By leveraging the features and capabilities of JMeter, you can perform extensive load testing and fix issues in your application before they become problematic. This book is written by JMeter developers and begins by discussing the whole process, including recording a script, setting it up, and launching it, enabling you to almost immediately start load testing. You'll learn the best practices that you must follow while designing test cases. You'll also explore the different protocols offered by JMeter through various real-world examples. Finally, you'll see how to integrate JMeter into the DevOps approach and create professional reports. You'll discover ways to use the eco-system of JMeter to integrate new protocols, enrich its monitoring, and leverage its power through the use of the cloud. By the end of this book, you'll know all that's needed to perform comprehensive load testing on your applications by using all the best practices and features of JMeter.

What you will learn

Explore various JMeter concepts, including Timers scope and Assertions scope Discover the types of test protocols and load tests that JMeter supports Design a realistic test scenario using various tips and best practices Prepare your test environment with injectors and the system under test Learn and apply good practices when recording a script Integrate JMeter with Jenkins using Maven

What do you get with eBook?

Product feature icon Instant access to your Digital eBook purchase
Product feature icon Download this book in EPUB and PDF formats
Product feature icon Access this title in our online reader with advanced features
Product feature icon DRM FREE - Read whenever, wherever and however you want
Buy Now

Product Details


Publication date : Aug 1, 2019
Length 468 pages
Edition : 1st Edition
Language : English
ISBN-13 : 9781839217647
Vendor :
Apache
Category :
Languages :

Table of Contents

14 Chapters
About the Book Chevron down icon Chevron up icon
Quick Start with JMeter Chevron down icon Chevron up icon
JMeter Overview Chevron down icon Chevron up icon
Designing a Test Case Chevron down icon Chevron up icon
Important Concepts in JMeter Chevron down icon Chevron up icon
Preparing the Test Environment (Injectors and Tested Systems) Chevron down icon Chevron up icon
Being Productive with JMeter Chevron down icon Chevron up icon
Load Testing a Website Chevron down icon Chevron up icon
Load Testing Web Services Chevron down icon Chevron up icon
Load Testing a Database Server Chevron down icon Chevron up icon
Load Testing Message-Oriented Middleware (MOM) via JMS Chevron down icon Chevron up icon
Performing a Load Test Chevron down icon Chevron up icon
Visualizing and Analyzing the Load Testing Results Chevron down icon Chevron up icon
Integration of JMeter in the DevOps Tool Chain Chevron down icon Chevron up icon

Customer reviews

Filter icon Filter
Top Reviews
Rating distribution
Empty star icon Empty star icon Empty star icon Empty star icon Empty star icon 0
(0 Ratings)
5 star 0%
4 star 0%
3 star 0%
2 star 0%
1 star 0%

Filter reviews by


No reviews found
Get free access to Packt library with over 7500+ books and video courses for 7 days!
Start Free Trial

FAQs

How do I buy and download an eBook? Chevron down icon Chevron up icon

Where there is an eBook version of a title available, you can buy it from the book details for that title. Add either the standalone eBook or the eBook and print book bundle to your shopping cart. Your eBook will show in your cart as a product on its own. After completing checkout and payment in the normal way, you will receive your receipt on the screen containing a link to a personalised PDF download file. This link will remain active for 30 days. You can download backup copies of the file by logging in to your account at any time.

If you already have Adobe reader installed, then clicking on the link will download and open the PDF file directly. If you don't, then save the PDF file on your machine and download the Reader to view it.

Please Note: Packt eBooks are non-returnable and non-refundable.

Packt eBook and Licensing When you buy an eBook from Packt Publishing, completing your purchase means you accept the terms of our licence agreement. Please read the full text of the agreement. In it we have tried to balance the need for the ebook to be usable for you the reader with our needs to protect the rights of us as Publishers and of our authors. In summary, the agreement says:

  • You may make copies of your eBook for your own use onto any machine
  • You may not pass copies of the eBook on to anyone else
How can I make a purchase on your website? Chevron down icon Chevron up icon

If you want to purchase a video course, eBook or Bundle (Print+eBook) please follow below steps:

  1. Register on our website using your email address and the password.
  2. Search for the title by name or ISBN using the search option.
  3. Select the title you want to purchase.
  4. Choose the format you wish to purchase the title in; if you order the Print Book, you get a free eBook copy of the same title. 
  5. Proceed with the checkout process (payment to be made using Credit Card, Debit Cart, or PayPal)
Where can I access support around an eBook? Chevron down icon Chevron up icon
  • If you experience a problem with using or installing Adobe Reader, the contact Adobe directly.
  • To view the errata for the book, see www.packtpub.com/support and view the pages for the title you have.
  • To view your account details or to download a new copy of the book go to www.packtpub.com/account
  • To contact us directly if a problem is not resolved, use www.packtpub.com/contact-us
What eBook formats do Packt support? Chevron down icon Chevron up icon

Our eBooks are currently available in a variety of formats such as PDF and ePubs. In the future, this may well change with trends and development in technology, but please note that our PDFs are not Adobe eBook Reader format, which has greater restrictions on security.

You will need to use Adobe Reader v9 or later in order to read Packt's PDF eBooks.

What are the benefits of eBooks? Chevron down icon Chevron up icon
  • You can get the information you need immediately
  • You can easily take them with you on a laptop
  • You can download them an unlimited number of times
  • You can print them out
  • They are copy-paste enabled
  • They are searchable
  • There is no password protection
  • They are lower price than print
  • They save resources and space
What is an eBook? Chevron down icon Chevron up icon

Packt eBooks are a complete electronic version of the print edition, available in PDF and ePub formats. Every piece of content down to the page numbering is the same. Because we save the costs of printing and shipping the book to you, we are able to offer eBooks at a lower cost than print editions.

When you have purchased an eBook, simply login to your account and click on the link in Your Download Area. We recommend you saving the file to your hard drive before opening it.

For optimal viewing of our eBooks, we recommend you download and install the free Adobe Reader version 9.