Using Business Intelligence Tools to Fix Data Integrity Issues
In the previous chapter, we discussed the data integrity features available in the most common business intelligence (BI) tools. We also covered how to get started with using them. In this chapter, we will delve into how to manage data integrity issues when using Microsoft Power BI, Tableau from Salesforce, and Alteryx. We will build on top of what we’ve learned already and explore various features to ensure the integrity of financial data.
That said, these are the topics that we will explore in this chapter:
- Managing data integrity issues with BI tools
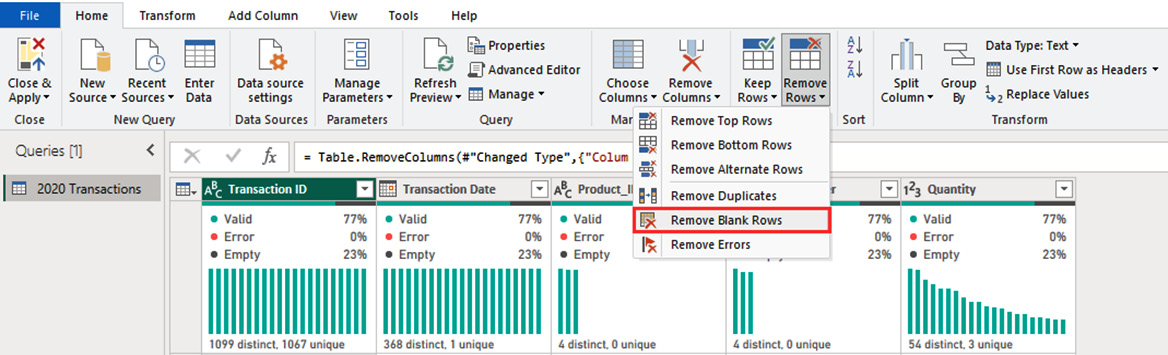
- Data profiling features
- Data cleansing methods
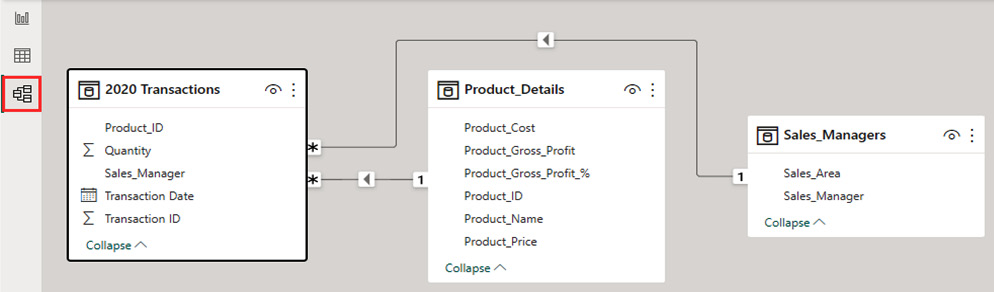
- Managing relationships in data models
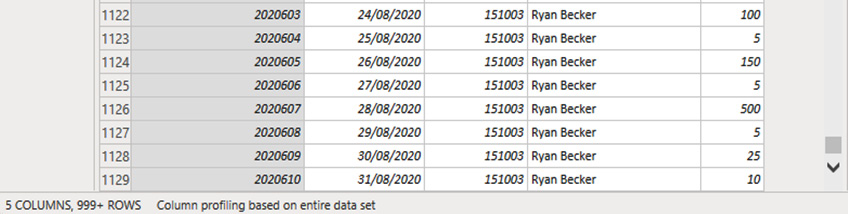
- Dealing with large financial datasets using data validation
By the end of this chapter, you will have gained a deeper understanding of what these BI tools are capable of, particularly in terms of fixing data integrity issues.