Chapter 8. Deeper Analysis – Trends, Clustering, Distributions, and Forecasting
Sometimes, quick data visualization needs a slightly deeper analysis. For example, a simple scatterplot can reveal outliers and correlation of values. But often you want to understand the distribution. A simple time series helps you see the rise and fall of a measure over time. But many times you want to see the trend or make predictions of future values.
Tableau enables you to quickly enhance your data visualizations with statistical analysis. Built-in features such as trending, clustering, distributions, and forecasting, allow you to quickly add value to your visual analysis. Additionally, Tableau integrates with R, an extensive statistical platform that opens up endless options for statistical analysis of your data. This chapter will cover the built-in statistical models and analysis.
This chapter will cover the following topics:
Trending
Clustering
Distributions
Forecasting
We'll take a look at these concepts...
World Population.xlsx is included in the Chapter 08 directory. It contains one record for each country for each year from 1960 to 2015, measuring population. Using this data set, let's take a look at the historical trends of various countries. Create a view similar to the following, which shows the change in population over time for Afghanistan and Australia. You'll notice that Country Name has been filtered to include only Afghanistan and Australia and the field has additionally been added to the Color and Label shelves:
From this visualization alone you can make several interesting observations. The growth of the two countries' populations was fairly similar up to 1980. At that point the population of Afghanistan went into decline until 1988 when the population of Afghanistan started to increase recover. At some point around 1996 the population of Afghanistan exceeded that of Australia. The gap has grown wider ever since.
While we have a sense of the two trends, they become even...
Tableau 10 introduces the ability to quickly perform clustering analysis in your visualizations. This allows you to find groups, or clusters, of individual data points that are similar based on any number of variables of your choosing. This can be useful in many different industries and fields of study, for example:
Marketing may find it useful to determine groups of customers related to each other based on spending amounts, frequency of purchases, times and days of orders, and so on
Patient care directors in hospitals may benefit from understanding groups of patients related to each other based on diagnoses, medication, length of stay, and number of read missions
Immunologists may search for related strains of bacteria based on drug resistance or genetic markers
Renewable energy professionals would like to pinpoint clusters of windmills based on energy production and then correlate that with geographic location
Note
Tableau uses a standard k-means clustering algorithm that will yield...
Analyzing distributions can be quite useful. We've already seen that certain calculations are available for determining statistical information such as averages, percentiles, and standard deviations. Tableau also makes it easy to quickly visualize various distributions including confidence intervals, percentages, percentiles, quantiles, and standard deviations.
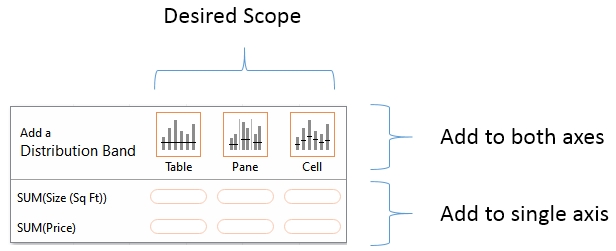
You may add any of these visual analytic features using the Analytics pane (alternately, you can right-click an axis and select Add Reference Line). Just like reference lines and bands, distribution analytics can be applied within the scope of a Table, Pane, or Cell. When you drag and drop the desired visual analytic, you'll have options for selecting the scope and the axis. In the following example we've dragged and dropped Distribution Band from the Analytics pane onto the scope of Pane for the axis defined by Sum(Price):
Once you have selected the scope and axis, you will be given options to change settings. You may...
As we've seen, trend models make predictions. Given a good model, you expect additional data to follow the trend. When the trend is over time, you can get some idea of where future values may fall. However, predicting future values often requires a different type of model. Factors such as seasonality can make a difference not predicted by a trend alone. Starting with version 8.0, Tableau includes built-in forecasting models that can be used to predict and visualize future values.
To use forecasting, you'll need a view that includes a date field or enough date parts for Tableau to reconstruct a date (for example, a Year and a Month field). Tableau 10 also allows for forecasting based on integers instead of dates. You may drag and drop a Forecast from the Analytics pane, navigate to Analysis | Forecast | Show Forecast from the menu, or right click the view's pane and select the option from the context menu.
Here, for example is the view of the population growth over time of Afghanistan...
Tableau provides an extensive set of features for adding value to your analysis. Trend lines allow you to more precisely identify outliers, determine which values fall within the predictions of certain models, and even make predictions of where measurements are expected. Tableau gives extensive visibility into trend models and even allows you to export data containing trend model predictions and residuals. Clusters enable you to find groups of related data points based on various factors. Distributions are useful for understanding a spread of values across a set of data. Forecasting allows for a complex model of trends and seasonality to predict future results. Having a good understanding of these tools will give you the ability to clarify and validate your initial visual analyses.
Next, we'll turn our attention back to the data. We considered very early on how to connect to data and we've been working with data ever since. However, we've spent most of our time working with clean...