When our system is running, we might have several nodes and many more topics publishing messages among nodes. Also, we might have nodes providing actions or services as well. For large systems, it is important to have tools that let us see what is running at a given time. ROS provides basic but powerful tools with this aim, from the CLI to GUI applications.
Listing nodes, topics, services, and parameters
In our honest opinion, we will start with the most basic level of introspection. We are going to see how to obtain the list of nodes running and topics and services available at a given time:
We recommend that you go back to Chapter 2, ROS Architecture and Concepts, to see how these commands also allow us to obtain the message type sent by a particular topic as well...
Setting dynamic parameters
If a node implements a dynamic reconfigure parameter server, we can use rqt_reconfigure to modify them on the fly. Run the following example, which implements a dynamic reconfigure server with several parameters (see the cfg file in the cfg folder of the package).
With the dynamic reconfigure server running, open the GUI with the following command:
Select the example6 server in the left-hand side table list, and you will see its parameters, which you can modify directly. The parameter changes take effect immediately, running the code inside a callback method in the source code, which checks for the validity of the values. In this example, the parameters are printed every time they are changed, that is, when the callback method is executed. The following screenshot encapsulates this discussion:
Dynamic parameters were originally meant for drivers, so it was easy to modify them...
When something weird happens
ROS has several tools to detect potential problems in all the elements of a given package. Just move with roscd to the package you want to analyze. Then, run roswtf. For chapter3_tutorials, we have the following output. Note that if you have something running, the ROS graph would be analyzed too. We run the roslaunch chapter3_tutorials example6.launch command that yields the an output similar to the following screenshot:
In general, we should expect no error or warning, but even some of them are innocuous. In the preceding screenshot, we see that roswtf does not detect any error; it only issues a warning about pip, which sometimes might generate problems with the Python code installed in the system. Note that the purpose of roswtf is to signal potential problems, and then we are responsible to check whether they are real or meaningless ones, as in the previous case.
Another useful tool is catkin_lint, which helps to diagnose errors with catkin, usually in the CMakeLists...
Visualizing node diagnostics
ROS nodes can provide diagnostic information using the diagnostics topic. For that, there is an API that helps to publish diagnostic information in a standard way. The information follows the diagnostic_msgs/DiagnositcStatus message type, which allows us to specify a level (OK, WARN, ERROR), name, message, and hardware ID as well as a list of diagnostic_msgs/KeyValue, which are pairs of key and value strings.
The interesting part comes with the tools to collect and visualize this diagnostic information. At the basic level, rqt_runtime_monitor allows us to visualize the information directly published through the diagnostics topic. Run the example7 node, which publishes information through the diagnostics topic and this visualization tool to see the diagnostic information:
The preceding commands display the following output:
When the system is large, we can aggregate diagnostic...
Scalar data can be easily plotted with generic tools already available in ROS. Even nonscalar data can be plotted, but with each scalar field plotted separately. That is why we talk about scalar data, because most nonscalar structures are better represented with ad hoc visualizers, some of which we will see later; for instance, images, poses, orientation/attitude, and so on.
Creating a time series plot with rqt_plot
Scalar data can be plotted as a time series over the time provided by the timestamps of the messages. Then, in the y axis, we will plot our scalar data. The tool to do so is rqt_plot. It has a powerful argument syntax, which allows specifying several fields of a structured message in a concise manner as well; we can also add or remove topics or fields manually from the GUI.
To show rqt_plot in action, we are going to use the example4 node since it publishes a scalar and a vector (nonscalar) in two different topics, which are temp and accel, respectively. The...
In ROS, we have a node that allows the display of images coming from a camera on-the-fly. This is an example of a topic with complex data, which is better visualized or analyzed with special tools. You only need a camera to do this, such as your laptop webcam. The example8 node implements a basic camera capture program using OpenCV and ROS bindings to convert cv::Mat images into ROS Image messages that can be published in a topic. This node publishes the camera frames in the /camera topic.
We are only going to run the node with a launch file created to do so. The code inside the node is still new for the reader, but in the next chapters, we will cover how to work with cameras and images in ROS, so we will be able to come back to this node and understand it:
Once the node is running, we can list the topics (rostopic list) and see that the /camera topic is there. A straightforward way to verify that we are actually capturing...
There are certain devices (such as stereo cameras, 3D lasers, the Kinect sensor, and so on) that provide 3D data—usually in the form of point clouds (organized/ordered or not). For this reason, it is extremely useful to have tools that visualize this type of data. In ROS, we have rviz or rqt_rviz, which integrates an OpenGL interface with a 3D world that represents sensor data in a world representation, using the frame of the sensor that reads the measurements in order to draw such readings in the correct position with respect to each other.
Visualizing data in a 3D world using rqt_rviz
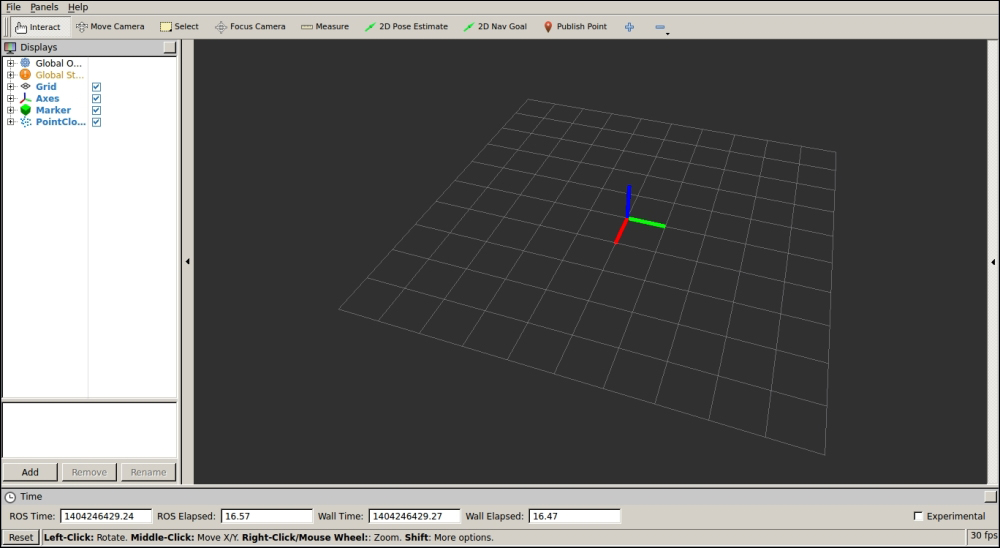
With roscore running, start rqt_rviz with (note that rviz is still valid in ROS hydro):
We will see the graphical interface of the following screenshot, which has a simple layout:
On the left-hand side, we have the Displays panel, in which we have a tree list of the different elements in the world, which appears in the middle. In this case, we have certain elements...
Saving and playing back data
Usually, when we work with robotic systems, the resources are shared, not always available, or the experiments cannot be done regularly because of the cost or time required for preparing and performing them or because they are difficult to reproduce. For this reason, it is a good practice to record the data of the experiment session for later analysis and to work, develop, and test our algorithms. However, the process of saving good data so that we can reproduce the experiment offline is not trivial. Fortunately, in ROS, we have powerful tools that have already solved this problem.
ROS can save all the messages published on any topic. It has the ability to create a bag file that contains the messages as they are with all their fields and timestamps. That allows the reproduction of the experiment offline with its real conditions on the robot as the latency of messages transmission. What's more, ROS tools do all this efficiently, with a high bandwidth, and in an...
Using the rqt_gui and rqt plugins
Since ROS Fuerte, the rx applications or tools are deprecated, and we should instead use the rqt nodes. They are basically the same, and only a few of them incorporate small updates, bug fixes, and new features. The following table shows the equivalences for the tools shown in this chapter (the ROS hydro rqt tool and the one it replaces from previous ROS distributions):
In ROS hydro, there are even more standalone plugins, such as a shell (rqt_shell), a topic publisher (rqt_publisher), a message type viewer (rqt_msg), and much more (the most important ones have been covered in this chapter). Even rqt_viz is a plugin, which replaces rviz, and can also be integrated into the new rqt_gui interface...
After reading and running the code of this chapter, you learned to use many tools that help you to develop robotic systems faster, debug errors, and visualize your results, so that you can evaluate their quality or validate them. Some of the specific concepts and tools you will exploit the most in your life as a robot developer have been summarized here.
Now you know how to include logging messages in your code with different levels of verbosity, which will help you to debug errors in your nodes. For this purpose, you can also use the powerful tools included in ROS, such as the rqt_console interface. Additionally, you can also inspect or list the nodes running, topics published, and services provided in the whole system. This includes the inspection of the node graph using rqt_graph.
Regarding the visualization tools, you should be able to plot scalar data using rqt_plot for a more intuitive analysis of certain variables published by your nodes. Similarly, you can view more complex...