Reader small image

You're reading from  Learning Predictive Analytics with R

Product typeBook
Published inSep 2015
Reading LevelIntermediate
PublisherPackt
ISBN-139781782169352
Edition1st Edition
Languages
Right arrow
Author (1)
Eric Mayor
Eric Mayor
author image
Eric Mayor

Eric Mayor is a senior researcher and lecturer at the University of Neuchatel, Switzerland. He is an enthusiastic user of open source and proprietary predictive analytics software packages, such as R, Rapidminer, and Weka. He analyzes data on a daily basis and is keen to share his knowledge in a simple way.
Read more about Eric Mayor

Right arrow

Chapter 12. Multilevel Analyses

In Chapter 10, Classification with k-Nearest Neighbors and Naïve Bayes, we discussed association with k-Nearest Neighbors and Naïve Bayes. In the previous chapter, we examined classification trees using notably C4.5, C50, CART, random forests, and conditional inference trees.

In this chapter, we will discuss:

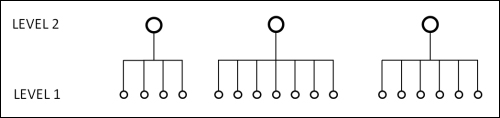
  • Nested data and the importance of dealing with them appropriately

  • Multilevel regression including random intercepts and random slopes

  • The comparison of multilevel models

  • Prediction using multilevel modeling

Nested data


If you have nested data, this chapter is essential for you! What is meant by nested data is that observations share a common context. The examples include:

  • Consumers nested within shops

  • Employees nested within managers

  • Teachers and/or students nested within schools

  • Nurses, patients, and/or physicians nested within hospitals

  • Inhabitants nested in neighborhoods

We could imagine way more cases of data nesting. What they all have in common is a data structure similar to the one depicted in the following figure:

A depiction of nested data

We will only discuss two levels of data with unique membership in this chapter, but of course, more complex situations can arise. For instance, in all the preceding examples, shops, managers, schools, hospitals, and neighborhoods can be nested within higher level units (for example, companies, cities) which could be a third level in the analyses). Also, crossed memberships could be imagined, for example, patients sharing a hospital but not a neighborhood...

Multilevel regression


To solve all these issues, we can rely on a kind of analysis that can partial out (take away) the variance due to the context. This can be done using multilevel regression analysis (also known as mixed-effect regression). We will not go into the detail of the computations of such highly complex analyses but will simply provide the amount of information necessary to understand and perform the analysis at a basic level. The necessary diagnostic checks are not fully presented here. Simply note that diagnostics for linear regression apply, and that additional diagnostics should be performed, such as checking the normality of residuals at level 2. We will not discuss this further here. The Handbook of multilevel analysis book, edited by De Leeuw and Meijer, provides the necessary information for diagnostics of multilevel models.

When we discussed regression in Chapter 9, Linear Regression, we showed that the value of a criterion attribute for an observation is computed as...

Multilevel modeling in R


Now that we have examined (laconically) the basics of multilevel modeling equations, we can turn to how to build multilevel models in R and predict unseen data.

For this purpose, we will first load our dataset produced using the same procedure as mentioned previously (except that the attributes are not scaled). Here again, there are 100 generated observations for each of the 17 hospitals:

NursesML = read.table("NursesML.dat", header = T, sep = " ")

The null model

We will examine the variation in our attributes considering hospitals and observations as a unit of analysis, that is, we will compare whether there is more variation at the hospital and observation levels. What we could do is compute this by hand.

The following will compute the mean for the attribute we want to predict (WorkSat) for each of the hospitals:

means = aggregate(NursesML[,4], by=list(NursesML[,5]), 
   FUN=mean)[2]

We can display the variance of work satisfaction in hospitals and observations as follows...

Predictions using multilevel models


Now that we have our model ready, we can predict work satisfaction in the testing dataset.

Using the predict() function

One way to do so is simply to use the predict() function. The allow.new.levels argument specifies that we allow new hospitals in the analysis. As we have the same hospitals in the training and testing sets, we set its value to F (false) (which is actually the default value):

NursesMLtest$predicted = predict(modelRS, NursesMLtest,
   allow.new.levels = F)

Assessing prediction quality

There is no perfect way to measure the quality of the predictions for nested data. A simple estimate of the quality of our prediction is the correlation test. Because of the nested structure of our dataset, we will perform the test for each hospital separately:

1  correls = matrix(nrow=17,ncol=3)
2  colnames(correls) = c("Correlation", "p value", "r squared")
3  for (i in 1:17){
4     dat = subset(NursesMLtest, hosp == i)
5     correls[i,1] = cor.test(dat$predicted...

Summary


In this chapter, we saw why it is necessary to use analyses that account for the structure of the data when dealing with nested data. We have examined how to fit several types of multilevel models and saw how to predict new data. In the next chapter, we will deal with text mining, including document classification.

lock icon
The rest of the chapter is locked
You have been reading a chapter from
Learning Predictive Analytics with R
Published in: Sep 2015Publisher: PacktISBN-13: 9781782169352
Register for a free Packt account to unlock a world of extra content!
A free Packt account unlocks extra newsletters, articles, discounted offers, and much more. Start advancing your knowledge today.
undefined
Unlock this book and the full library FREE for 7 days
Get unlimited access to 7000+ expert-authored eBooks and videos courses covering every tech area you can think of
Renews at $15.99/month. Cancel anytime

Author (1)

author image
Eric Mayor

Eric Mayor is a senior researcher and lecturer at the University of Neuchatel, Switzerland. He is an enthusiastic user of open source and proprietary predictive analytics software packages, such as R, Rapidminer, and Weka. He analyzes data on a daily basis and is keen to share his knowledge in a simple way.
Read more about Eric Mayor