Time series data is one of the most common formats of data, and it is used to describe an event or phenomena that occurs over time. Time series data has a simple requirement—its values need to be captured at equally spaced time intervals, such as seconds, minutes, hours, days, months, and so on. This important characteristic is one of the main attributes of the series and is known as the frequency of the series. We usually add the frequency along with the name of the series. For example, the following diagram describes the four time series from different domains (power and utilities, finance, economics, and science):
- The UK hourly demand for electricity
- The S&P 500 daily closing values
- The US monthly unemployment rate
- The annual number of sunspots
The following diagram shows the (1) UK hourly demand for electricity, (2) S&P 500 daily closing values, (3) US monthly unemployment rate, and (4) annual number of sunspots:
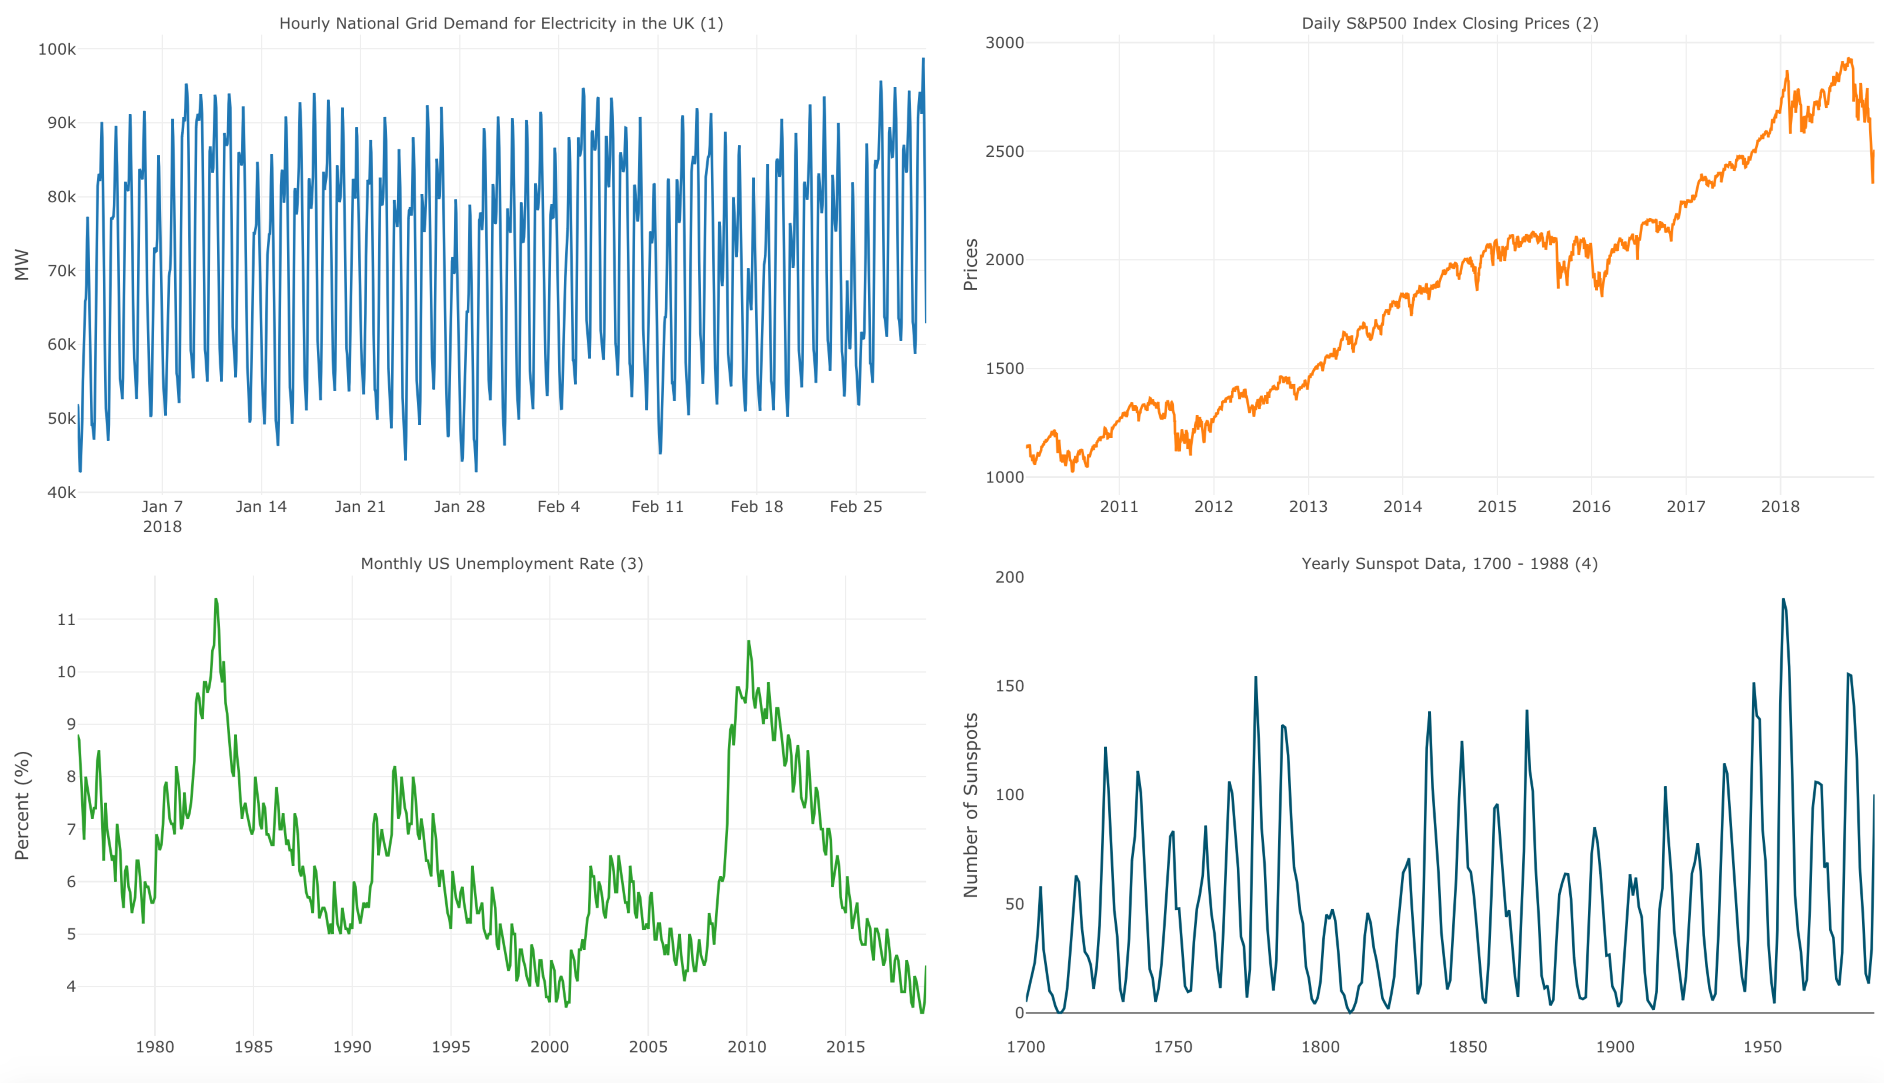
Taking a quick look at the four series, we can identify common characteristics of time series data:
- Seasonality: If we look at graph 1, there is high demand during the day and low demand during the night time.
- Trend: A clear upper trend can be seen in graph 2 that's between 2013 and 2017.
- Cycles: We can see cyclic patterns in both graph 3 and graph 4.
- Correlation: Although S&P 500 and the US unemployment rate are presented with different frequencies, you can see that the unemployment rate has decreased since 2013 (negative trend). On the other hand, S&P 500 increased during the same period (positive trend). We can make a hypothesis that there is a negative correlation between the two series and then test it.
Don't worry if you are not familiar with these terms at the moment. In Chapter 5, Decomposing Time Series Data, we will dive into the details of the series' structural components—seasonality, trend, and cycle. Chapter 6, Seasonality Analysis, is dedicated to the analysis of seasonal patterns of time series data, and Chapter 7, Correlation Analysis, is dedicated to methods and techniques for analyzing and identifying correlation in time series data.