In this section, we introduce and clarify the meaning of some of the terms we will be using throughout the book. Part of what is confusing for beginners in this field is sometimes the terminologies. There are many words for the same concept. One extreme example is variable, feature, attribute, independent variable, predictor, regressor, covariate, explanatory variable, input, and factor: they all may refer to the same thing! The reason for this (I must admit) shameful situation is that many practitioners of predictive analytics come from different fields (statistics, econometrics, computer science, operations research, and so on) and their community has its own way to name things, so when they come to predictive analytics they bring their vocabulary with them. But don't worry, you'll get used to it.
OK, now let's look at some of the fundamental concepts. Keep in mind that the terms won't be defined too formally, and you don't need to memorize them word by word (nobody will test you!). My intention is for us to have a common understanding of what we will be talking about. Since we have seen that data is the raw material of predictive analytics, let's define some key concepts:
- Data: Any record that is captured and stored and that is meaningful in some context.
- Unit of observation: The entity that is the subject of analysis. Although many a time it will be clear from the context, sometimes it can be tricky to define (especially when talking at a high level with non-technical people). Suppose that you are asked to analyze "sales data" for a set of stores in a supermarket chain. There can be many units of observation that can be defined for this (vaguely defined) task: stores, cash registers, transactions, days, and so on. Once you know what the unit of observation is (customers, houses, patients, cities, cells, rocks, stars, books, products, transactions, tweets, websites, and so on) you can start asking about their attributes.
- Attribute: A characteristic of a unit of analysis. If our unit of analysis is a patient, then examples of attributes of the patient could be age, height, weight, body mass index, cholesterol level, and so on.
- Data point, sample, observation, and instance: A single unit of observation with all its available attributes.
- Dataset: A collection of data points, usually in a table format; think of a relational database table or a spreadsheet.
For many problems, the data comes in an unstructured format, such as video, audio, a set of tweets, and blog posts. However, in predictive analytics, when we talk about a dataset, we often implicitly mean a structured dataset: a table or a set of mutually related tables. It is very likely that a big portion of your time at your job when doing predictive analytics is spent transforming unstructured raw data into a structured dataset.
From here, when we refer to a dataset, we will be talking about a single table; although in the real world a dataset may consist of multiple tables, when we do predictive modeling we do it with a single table. The typical table looks like this:

In the former dataset, our unit of observation is a customer, the entity of interest. Every row is an observation or a data point and, as you can see, each data point has a number of attributes (Customer ID, Age, Preferential status, and so on). Now, let's talk about the vocabulary used for modeling in relation to a dataset: first, every column in our dataset is considered a variable in the mathematical sense: their values are subject to change; they can vary from one data point to another data point. One of the most important things to know about the variables in a dataset is their types, which can be the following:
- Categorical variables: Variables that can be accepted as values with only a finite number of categories such as gender, country, type of transaction, age group, marital status, movie genre, and so on. Within this type of variables there are two sub-types:
- Ordinal variables: When the categories have some natural ordering: for instance, age groups (21–30, 31–40, 41–50, 51+) or shirt size (small, medium, large)
- Nominal variables: Those categorical variables whose values have no meaningful order
- Numerical variables: Variables whose values can vary in some defined interval. There are two sub-types, although the distinction in most cases won't be as important:
- Continuous variables: Those that in principle can take any value within an interval: the height of a person, stock prices, the mass of a star, and credit card balance are examples of continuous variables
- Integer variables: Those that can take only values that are integer numbers: number of children, age (if measured in years), the number of rooms in a house, and so on
One of the columns in our dataset plays a very important role: the one that we are interested in predicting. We call this column target, dependent variable, response, outcome, and output variable: the quantity or event that is being predicted. It is usually denoted by y and it is one of the columns in the dataset. We will use the term target throughout the book.
Once the target is identified, the rest of the columns are candidates to become features, attributes, independent variables, predictors, regressors, explanatory variables, and inputs: the columns in our dataset that will be used to predict the target. We will use the terms variables and feature throughout the book.
Finally, we can give a definition of Predictive Model: a method that uses the features to predict the target. It can also be thought of like a mathematical function: a predictive model takes inputs, meaning the set of features, the target, and outputs the predictions for the values of the target. At a high level, one way to think about a predictive model is like this:
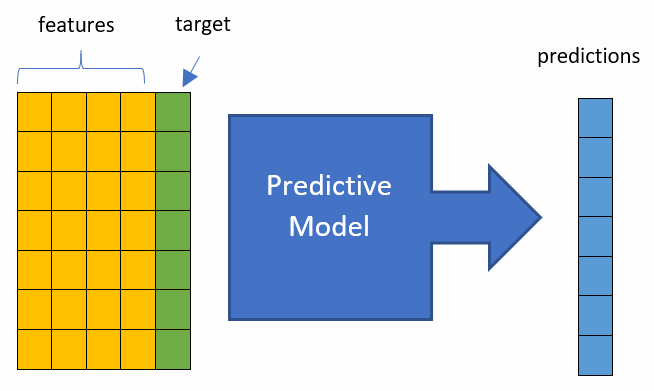
This diagram is limited (and some might say it is even wrong), but for now I think it will give you a general idea of what a predictive model is. We will, of course, delve deeper into the details of predictive models and we will build many of them in the following chapters.
Now that we have a clear understanding of what predictive analytics is, and some of the most important terminology we will be using in the book, it is time to take a look at how it is done in practice: the predictive analytics process.