Search icon
Subscription
0
Cart icon
Close icon
You have no products in your basket yet
Save more on your purchases!
Savings automatically calculated. No voucher code required
Arrow left icon
All Products
Best Sellers
New Releases
Books
Videos
Audiobooks
Learning Hub
Newsletters
Free Learning
Arrow right icon
Hands-On Graph Analytics with Neo4j

You're reading from  Hands-On Graph Analytics with Neo4j

Product type Book
Published in Aug 2020
Publisher Packt
ISBN-13 9781839212611
Pages 510 pages
Edition 1st Edition
Languages
Author (1):
Estelle Scifo Estelle Scifo
Profile icon Estelle Scifo

Table of Contents (18) Chapters

Preface 1. Section 1: Graph Modeling with Neo4j
2. Graph Databases 3. The Cypher Query Language 4. Empowering Your Business with Pure Cypher 5. Section 2: Graph Algorithms
6. The Graph Data Science Library and Path Finding 7. Spatial Data 8. Node Importance 9. Community Detection and Similarity Measures 10. Section 3: Machine Learning on Graphs
11. Using Graph-based Features in Machine Learning 12. Predicting Relationships 13. Graph Embedding - from Graphs to Matrices 14. Section 4: Neo4j for Production
15. Using Neo4j in Your Web Application 16. Neo4j at Scale 17. Other Books You May Enjoy

Building a data science project

Machine learning can be defined as the process from which an algorithm learns from data in order to be able to extract information that is useful for some business or research interest.

Even though all data science projects are different, a certain number of common steps can still be identified:
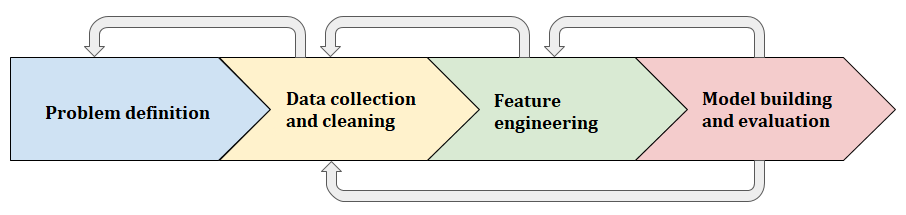
  1. Problem definition
  2. Data collection and cleaning
  3. Feature engineering
  4. Model building and evaluation
  5. Deployment

Even if these steps follow a logical order, the process is never linear and consists of back and forth operations between these different steps. It can be useful to go back to the problem definition after the data collection phase, for example, as well as returning to the feature engineering and model evaluation phases as many times as required to reach the desired outcomes. The following diagram illustrates this idea of moving back and forth between the different steps of a project:

This project structure also applies when analyzing graph data, which...

lock icon The rest of the chapter is locked
Register for a free Packt account to unlock a world of extra content!
A free Packt account unlocks extra newsletters, articles, discounted offers, and much more. Start advancing your knowledge today.
Unlock this book and the full library FREE for 7 days
Get unlimited access to 7000+ expert-authored eBooks and videos courses covering every tech area you can think of
Renews at $15.99/month. Cancel anytime}