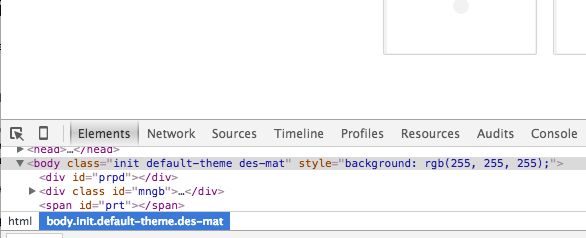
Chrome Developer Tools are indispensable to Web development. Most modern browsers have something similar, but to keep this book shorter, we'll stick to just Chrome here for the sake of simplicity. Feel free to use a different browser. Firefox's Developer Edition is particularly nice, and--yeah yeah, I hear you guys at the back--Opera is good too! We will mostly use the Elements and Console tabs, Elements to inspect the DOM and Console to play with JavaScript code and look for any problems. The other six tabs come in handy for large projects:
The Network tab will let you know how long files will take to load and help you inspect the Ajax requests. The Profiles tab will help you profile JavaScript for performance. The Resources tab is good for inspecting client-side data. Timeline and Audits are useful when you have a global variable that is leaking memory and you're trying to work out exactly why your library is suddenly causing Chrome to use 500 MB of RAM. While I've used these in D3 development, they're probably more useful when building large Web applications with frameworks such as React and Angular.
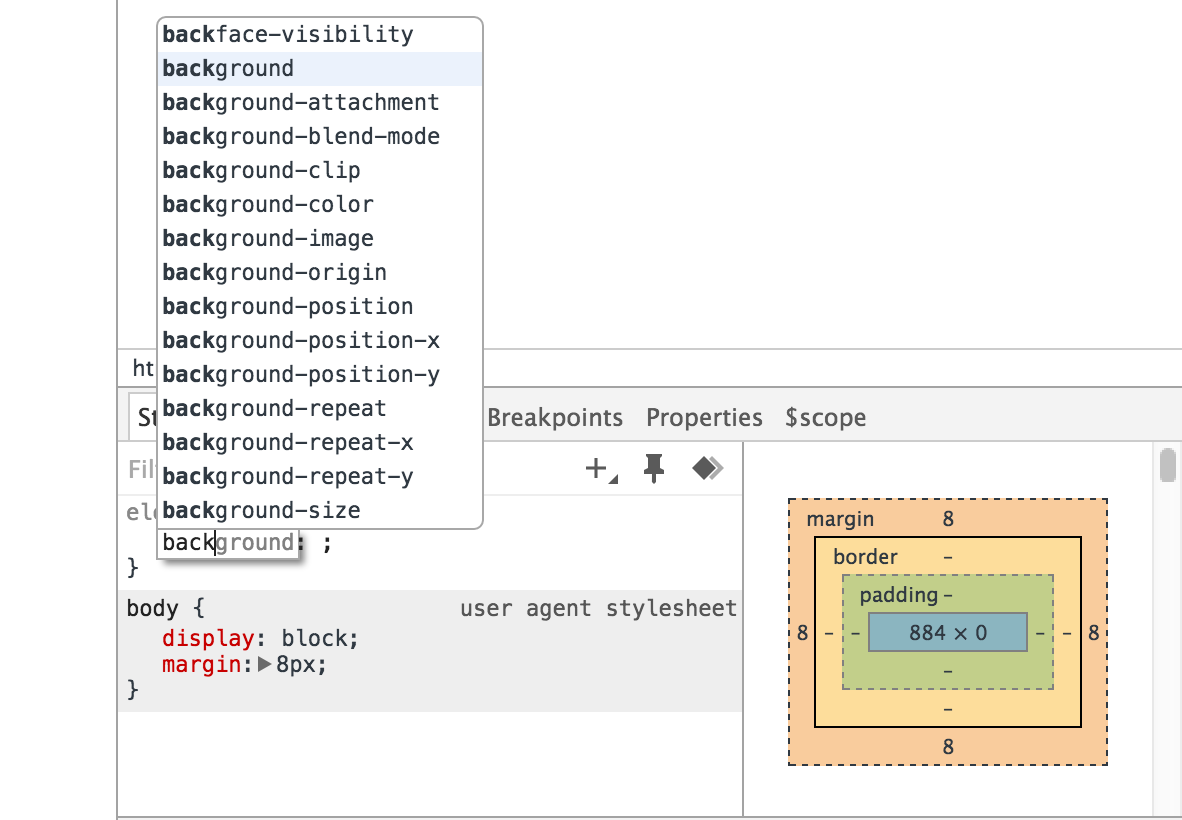
The main one you want to focus on, however, is Sources, which shows all the source code files that have been pulled in by the web page. Not only is this useful in determining whether your code is actually loading, it also contains a fully functional JavaScript debugger, which few mortals dare to use. Although explaining how to debug code is kind of boring and not at the level of this chapter, learning to use breakpoints instead of perpetually using console.log to figure out what your code is doing, is a skill that will take you far in the years to come. For a good overview, visit https://developers.google.com/web/tools/chrome-devtools/debug/breakpoints/step-code?hl=en Most of what you'll do with Developer Tools, however, involves looking at the CSS inspector at the right-hand side of the Elements tab. It can tell you what CSS rules are impacting the styling of an element, which is very good for hunting rogue rules that are messing things up. You can also edit the CSS and immediately see the results, as follows: