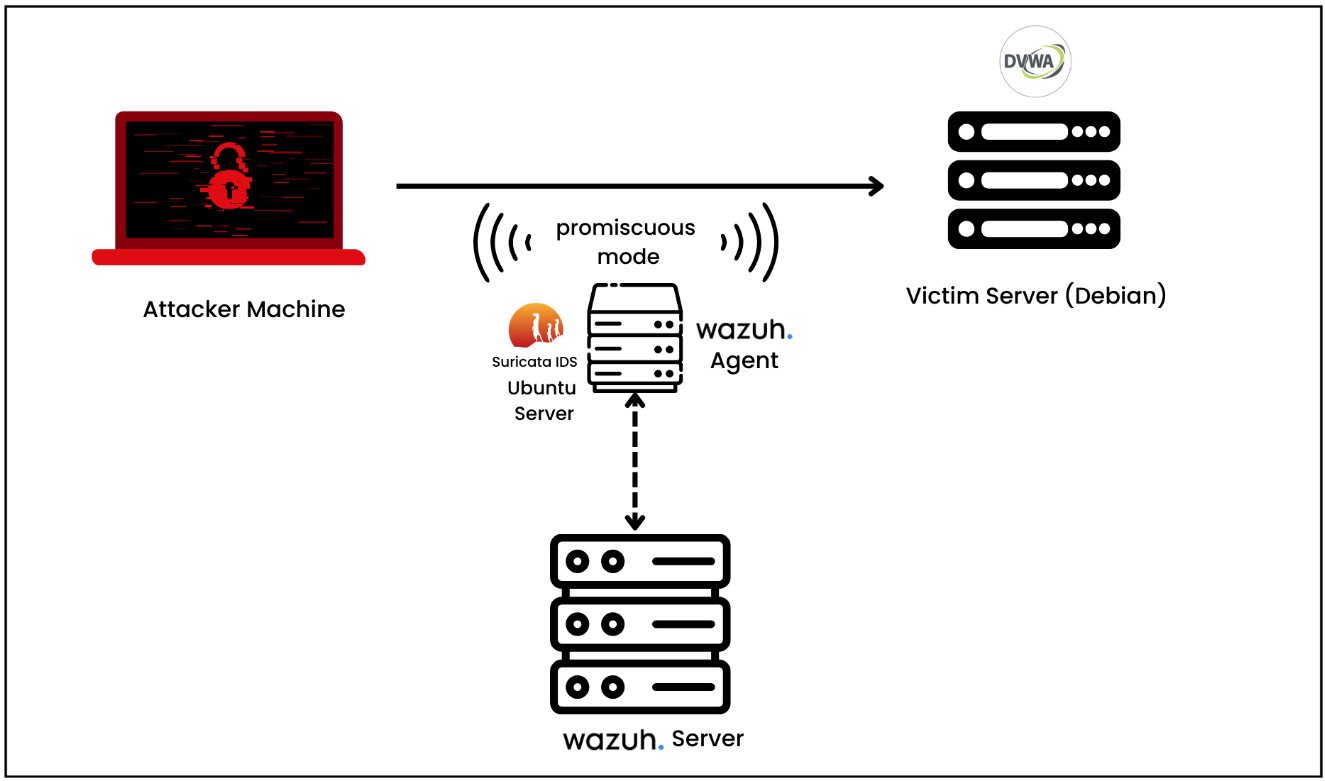
Wazuh is an open-source security monitoring platform that provides extended detection and response (XDR) and SIEM functionality. Wazuh’s capabilities include log analysis, intrusion detection, vulnerability detection, and real-time alerting, helping organizations enhance their security posture and respond to threats effectively. In this section, we will first get a basic understanding of the Wazuh platform and its core components and deployment methods, and then we will set up the Wazuh agent and connect with the Wazuh platform. Next, we will set up a Suricata IDS and integrate it with the Wazuh agent. Some of the main points we will explore are as follows:
- Core components of Wazuh
- Wazuh deployment options
- Wazuh core features
- Wazuh modules
- Wazuh administration
- Installing the Wazuh server
- Installing the Wazuh agent
- Installing Suricata on Ubuntu Server
- Setting up Windows Server with Suricata
The core components of Wazuh
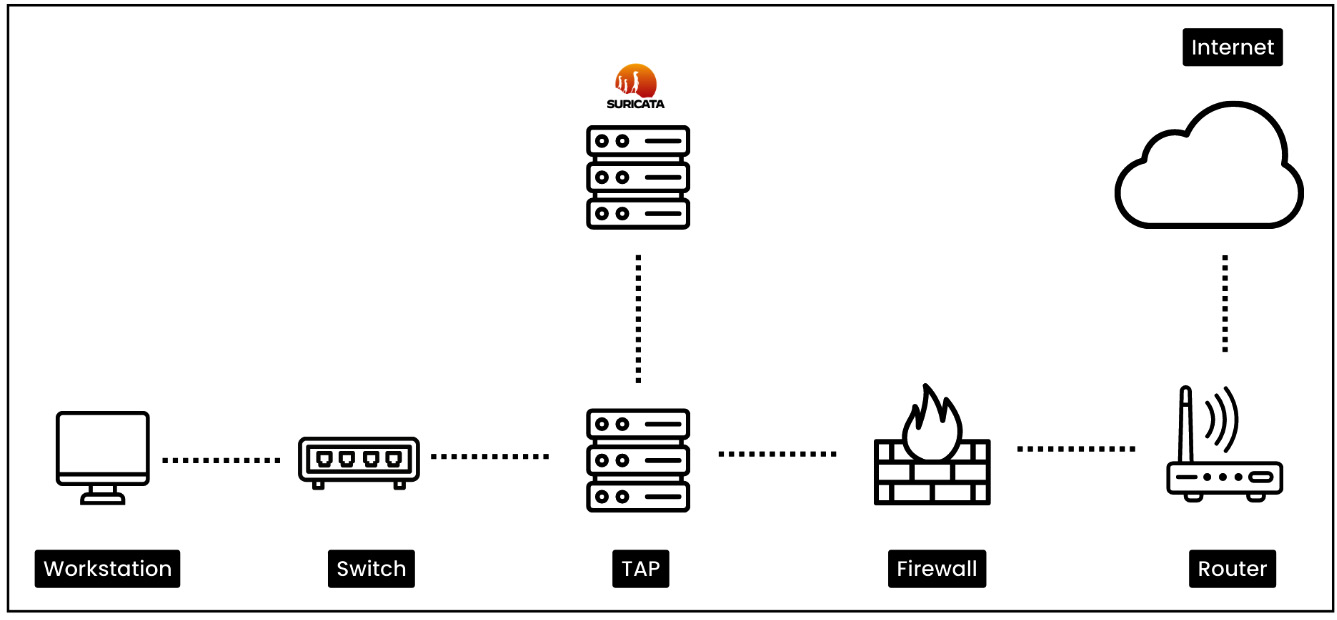
Wazuh provides a centralized platform for monitoring and managing security events across the organization’s IT infrastructure. Wazuh collects, analyzes, and connects log data from different sources, such as endpoints, network devices, firewalls, proxy servers, and cloud instances. Once the logs are collected, Wazuh provides several capabilities to the security team such as file integrity monitoring, malware detection, vulnerability detection, command monitoring, system inventory, threat hunting, security configuration assessment, and incident response. The Wazuh solution is made up of three main parts: the Wazuh server, the Wazuh indexer, and the Wazuh dashboard. The Wazuh agent is installed on the endpoints that need to be monitored.
The Wazuh server
This central component is also used to manage the agents and analyze the data received from them:
- It collects logs from several sources such as hosts, network devices, firewalls, proxy servers, and syslog servers.
- Normalizes and standardizes collected logs and events into a uniform format for analysis and correlation. It utilizes the Wazuh decoder to parse logs to display the logs in a uniform format.
- The Wazuh server is capable of integrating logs from several data sources such as syslog, Windows event logs, Windows Sysmon, Docker logs, Palo Alto firewall logs, and Check Point firewall logs.
- The Wazuh server also provides an API for interaction, allowing remote servers or systems to interact and query, for example, the number of active Wazuh agents, vulnerability information, Wazuh rule verification, and so on.
The Wazuh indexer
It is responsible for indexing and storing alerts generated by the Wazuh server:
- The Wazuh indexer stores alerts sent by the Wazuh server and acts as a primary repository
- It’s made to handle a lot of security alerts, making sure that storage and indexing work well as the system grows
Note
Indexing is the process of arranging and arranging data to enable effective and quick retrieval. It involves creating a data structure called an index.
- The Wazuh indexer provides robust search features that make it possible to quickly and thoroughly search through saved alerts using particular criteria or patterns
- The Wazuh indexer uses four index patterns to store the data:
wazuh-alerts-*: This is the index pattern for alerts generated by the Wazuh serverwazuharchives-*: This is the index pattern for all events sent to the Wazuh serverwazuh-monitoring-*: This pattern is for monitoring the status of Wazuh agentswazuh-statistics-*: This is used for statistical information about the Wazuh server
The Wazuh dashboard
The Wazuh dashboard is a web interface that allows you to perform visualization and analysis. It also allows you to create rules, monitor events, monitor regulatory compliances (such as PCI DSS, GDPR, CIS, HIPPA, and NIST 800-53), detect vulnerable applications, and much more.
Wazuh agents
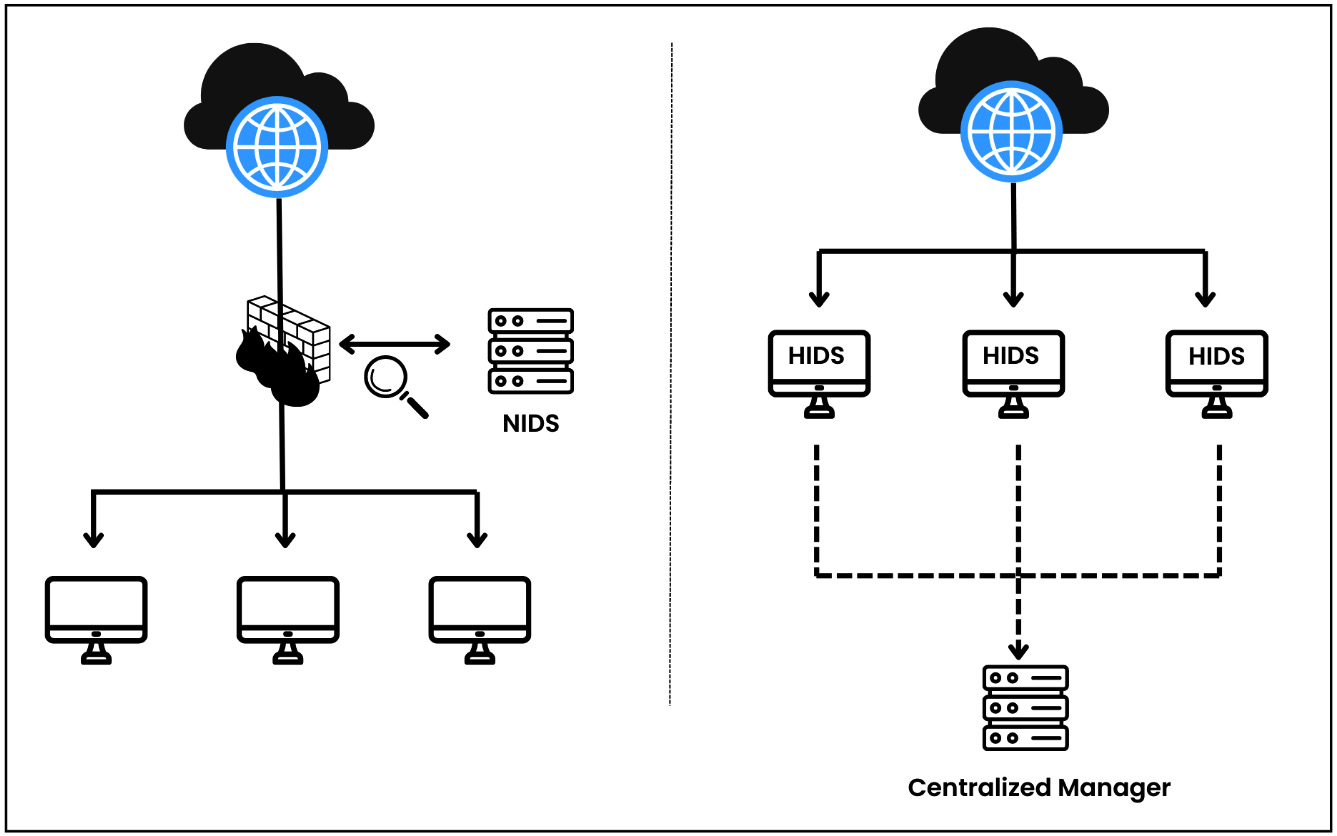
Wazuh agents are installed on endpoints such as servers, desktops, laptops, cloud compute instances, or VMs. Wazuh utilizes the OSSEC HIDS module to collect all the endpoint events.
Note
OSSEC is a popular and open-source host-based IDS (HIDS). It is a powerful correlation and analysis module that integrates log analysis, file integrity monitoring, Windows registry monitoring, centralized policy enforcement, rootkit detection, real-time alerting, and active response. It can be installed on most operating systems (OSs) such as Linux, OpenBSD, FreeBSD, MacOS and Windows.Wazuh deployment options
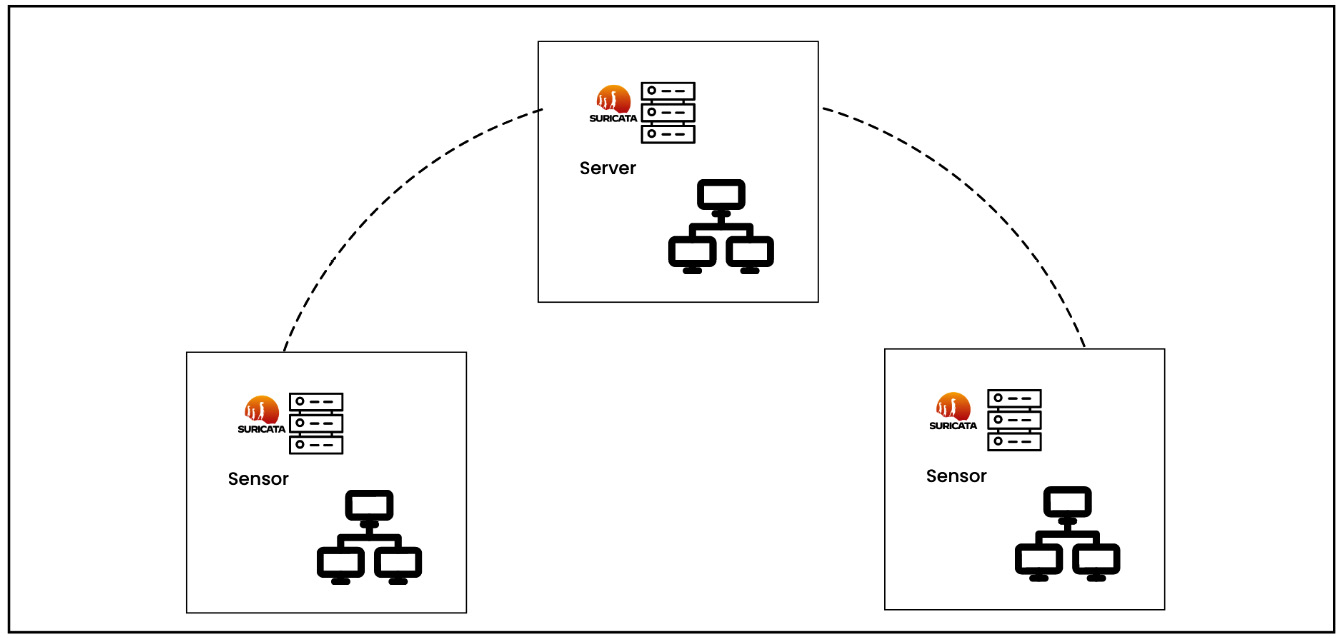
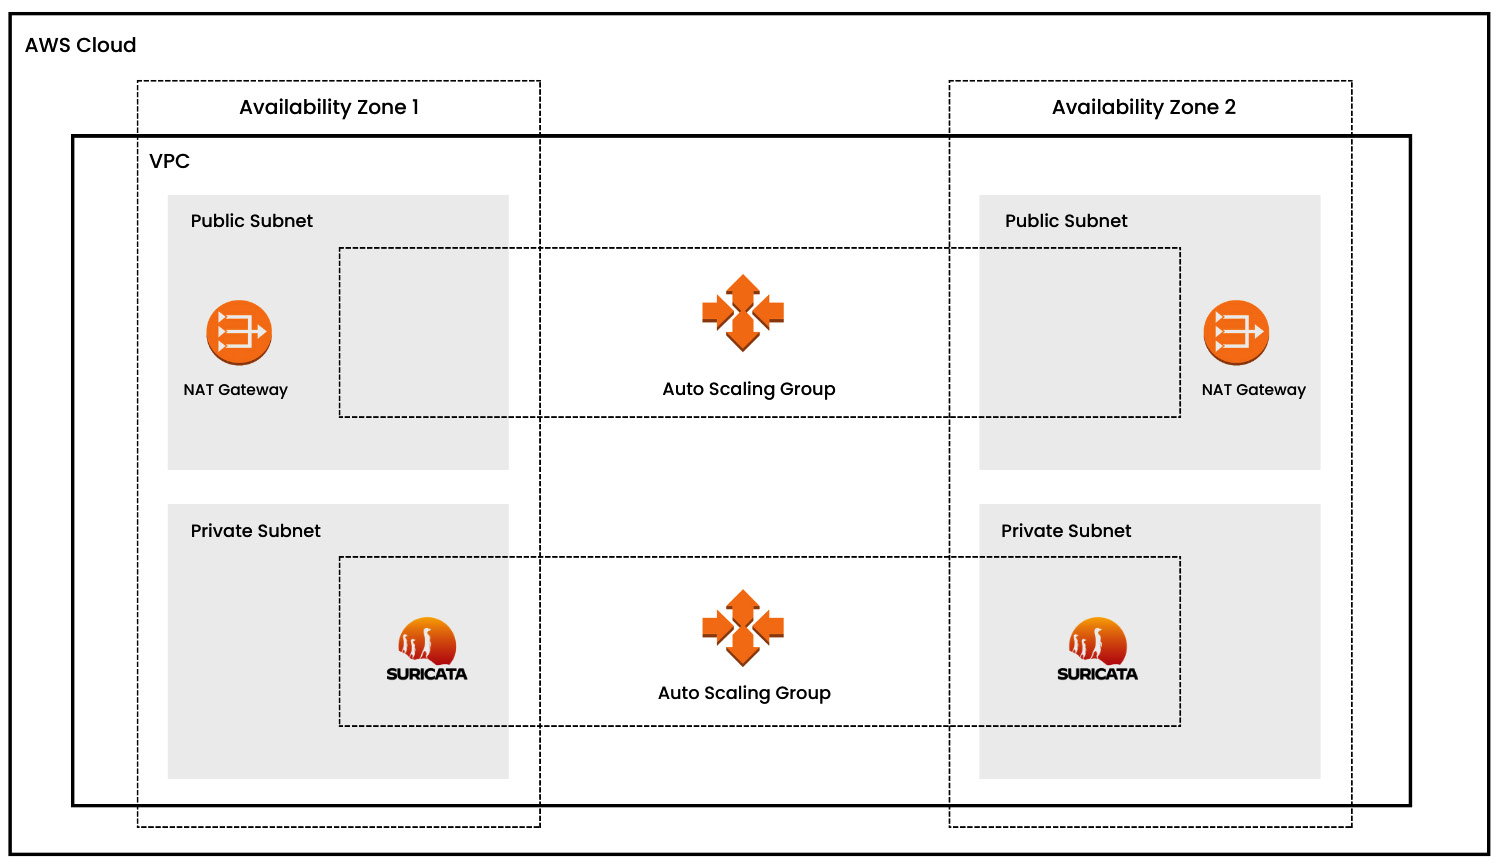
Wazuh is known for its ability to fully monitor security and detect threats. It also has several flexible deployment options. Depending on your requirement, you can deploy Wazuh in an on-premises server, cloud, Docker container, Kubernetes, or another environment. For a production environment, Wazuh core components (i.e., the Wazuh server, the Wazuh indexer, and the Wazuh dashboard) should be installed in cluster mode. Cluster mode deployment involves setting up more than one Wazuh server node to work collectively. By spreading the work and duties among several nodes in the cluster, this configuration aims to improve speed, scalability, and resilience. Let’s cover some important deployment options:
- Servers: Putting Wazuh on dedicated servers gives you more power and lets you make changes that work with your system. You can utilize on-premises servers or cloud instances. Remember, you need multiple server instances to deploy Wazuh in cluster mode.
- VM image: Wazuh gives you an Open Virtual Appliance (OVA) formatted VM image that is already set up. This can be imported straight into VirtualBox or any other virtualization software that works with OVA files. This is good for a lab purpose only. You can use this deployment option to test all the scenarios mentioned in this book. Download the OVA file from here: https://documentation.wazuh.com/current/deployment-options/virtual-machine/virtual-machine.html.
- Docker container: Docker is an open platform for building and running applications inside an isolated software container. Docker containers are the best way to quickly and easily set up Wazuh components in independent environments. This option is commonly used for testing, development, or situations where setup and takedown need to be done quickly. You can download the Docker image from the link here: https://hub.docker.com/u/wazuh.
- Deployment on Kubernetes: Kubernetes is an open-source container orchestration platform. You can opt for this method when managing large-scale deployment with multiple containers. This method gives you higher scalability, automated deployment, and resource optimization. You can check out the Wazuh Kubernetes repository at the following link: https://github.com/wazuh/wazuh-kubernetes.
If you want to test all the use cases throughout the book, I suggest you use the Wazuh VM deployment option by downloading the OVA file; however, for the production-level deployment, you can choose any of the remaining options. The Wazuh community has done a brilliant job in documenting the installation guide. You can refer to this link for step-by-step assistance: https://documentation.wazuh.com/current/installation-guide/index.html.
Wazuh modules
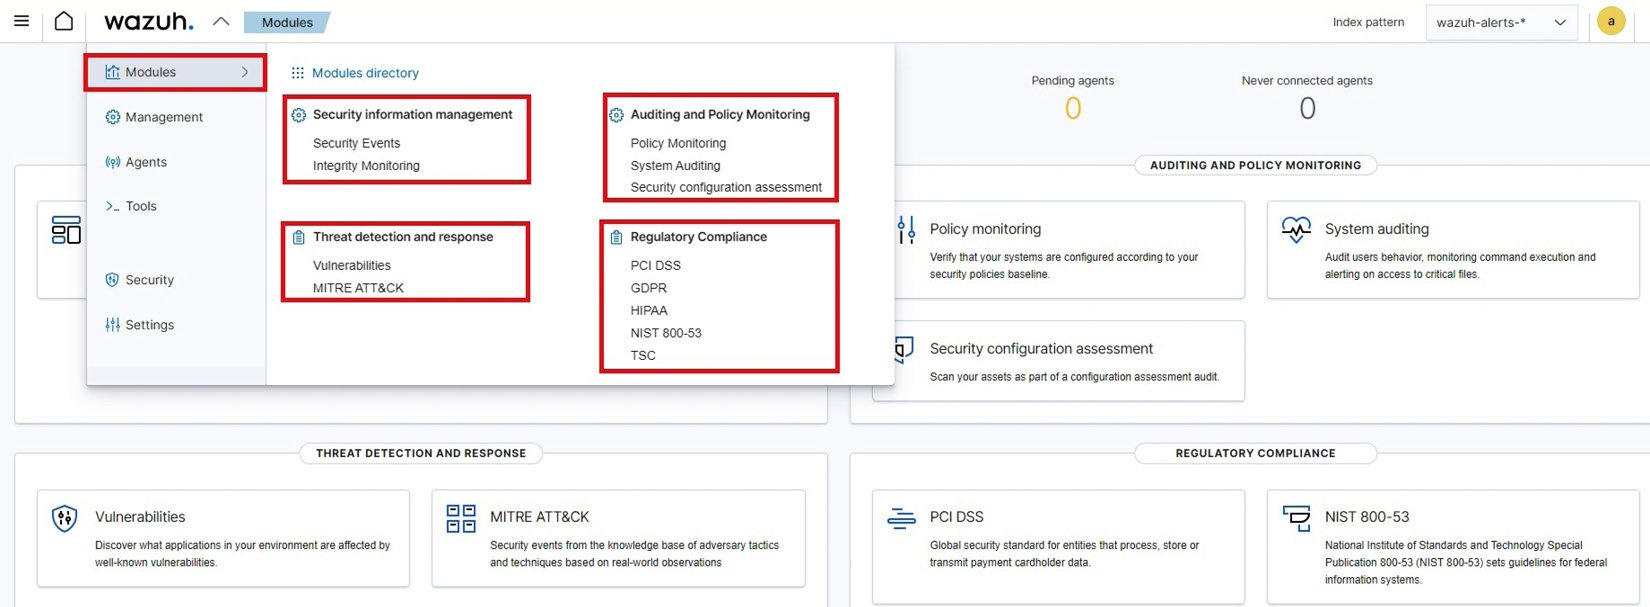
Wazuh has a set of modules that work together to help organizations handle security events, find threats, make sure they are following the rules, and keep their systems and data safe. Once you access the Wazuh manager, the topmost option is Modules. By default, you can find multiple modules categorized under four sections as mentioned in the following diagram:
Figure 1.6 – Default Wazuh modules
Let us look into each of those four sections in detail:
- Security information management: This consists of the Security Events and Integrity Monitoring module. Security alerts will be triggered and displayed based on predefined Wazuh rules for identified security events. The Integrity Monitoring module monitors any unauthorized changes to critical system files and directories.
- Threat detection and response: By default, this section has two modules: Vulnerabilities and MITRE ATT&CK®. However, you can also add Osquery, VirusTotal, and more. The Vulnerabilities module identifies, and tracks known vulnerabilities in the systems or software. The MITRE ATT&CK module maps detected threats or incidents to the MITRE ATT&CK framework.
Note
ATT&CK stands for adversarial tactics, techniques, and common knowledge. MITRE is a government-funded research organization based in Bedford, MA, and McLean, VA. MITRE ATT&CK is a framework that helps organizations with attacker’s tactics, techniques, and procedures to test their security controls.
- Auditing and Policy Monitoring: This section consists of three modules: the Policy Monitoring module, the System Auditing module, and the Security configuration assessment module.
- The Policy Monitoring module monitors the systems to make sure security policies are properly established.
- The System Auditing module tracks and audits use activities including use login attempts, file access, and privilege changes in the endpoint.
- The Security configuration assessment module is a very popular feature that checks system configurations against best practices or predefined security standards. Wazuh utilizes the CIS benchmark for most of the security configuration checks.
Note
The Center for Internet Security (CIS) benchmarks are a set of best practices that are known around the world and are based on consensus. They are meant to help security professionals set up and manage their cybersecurity defenses.
- Regulatory Compliance: This section consists of multiple modules including PCI DSS compliance, GDPR, HIPPA, NIST 800-53, and TSC modules. Wazuh rules are created and tagged with some of these compliances. When any of those rules get triggered, we see the alerts. This is how we can align security compliances with Wazuh.
Next, let’s talk about the Wazuh Administration, where we will discuss some core features of the Wazuh manager.
Wazuh Administration
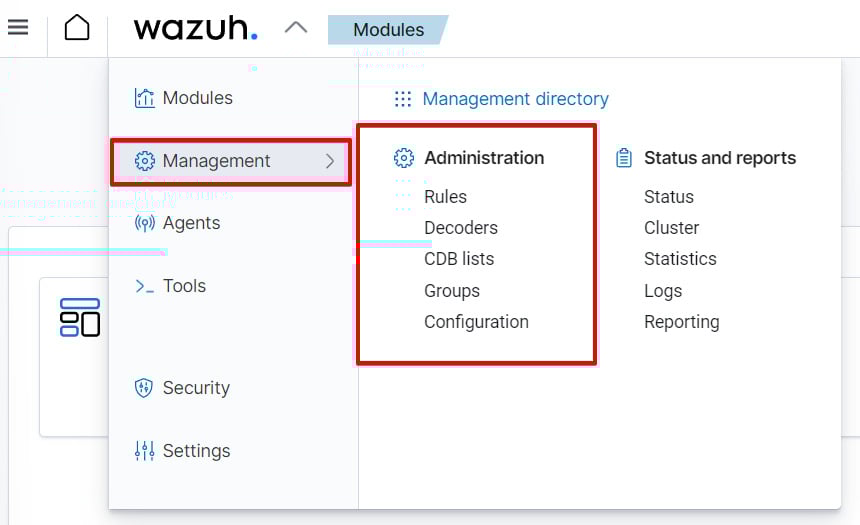
Under the Management section of the Wazuh dashboard, we have the Administration section. As you can see in the following diagram, the Administration section includes capabilities such as Rules, Decoders, CDB lists, Groups, and Configuration.
Figure 1.7 – Wazuh administration
All the features mentioned under the Administration tab play a pivotal role in ensuring the effectiveness of the Wazuh platform for real-time monitoring and threat detection. We will understand each of these features as explained in the following sections.
Decoders
Decoders are responsible for reading incoming log entries, pulling out the important information, and putting them into a standard format that the Wazuh system can easily understand and analyze. Raw log entries can be in different formats, such as syslog, JSON, XML, or custom text formats. The job of the decoder is to figure out how these logs are put together and pull out meaningful fields and values. There are many pre-built decoders in Wazuh such as the syslog decoder, OpenSSH decoder, Suricata decoder, and the Cisco ASA decoder. To understand what decoders are and how they work, let us look at how logs from the Barracuda Web Application Firewall (WAF) are processed:
<decoder name="barracuda-svf1">
    <parent>barracuda-svf-email</parent>
    <prematch>^\S+[\S+]|</prematch>
    <prematch>^\S+</prematch>
    <regex>^\S+[(\S+)] (\d+-\w+-\w+) \d+ \d+ |</regex>
    <regex>^(\S+) (\d+-\w+-\w+) \d+ \d+ </regex>
    <order>srcip, id</order>
</decoder>
Let’s break down the parts of this Wazuh decoder:
decoder name: This indicates the name of the decoder.parent: This gives us the name of the parent decoder. The parent decoder will be processed before the child decoders.prematch: This is like a condition that must match to apply the decoder. It uses regular expressions to look for a match.regex: This represents the regular expression to extract data. In the preceding decoder, we have two regex instances.order: This indicates the list of fields in which the extracted information or value will be stored.
Decoders have many more configuration options available to them. Visit the Decoders Syntax page (https://documentation.wazuh.com/current/user-manual/ruleset/ruleset-xml-syntax/decoders.html) in the Wazuh documentation to see all of the available options.
Rules
Wazuh rules help the system detect attacks in the early stages, such as intrusions, software misuse, configuration issues, application errors, malware, rootkits, system anomalies, and security policy violations. Wazuh comes with several pre-built rules and decoders but also allows you to add custom rules. Let’s take a sample Wazuh rule:
<rule id="200101" level="1">
    <if_sid>60009</if_sid>
    <field name="win.system.providerName">^PowerShell$</field>
    <mitre>
      <id>T1086</id>
    </mitre>
    <options>no_full_log</options>
    <group>windows_powershell,</group>
    <description>Powershell Information EventLog</description>
  </rule>
Let’s break this code down:
rule id: This represents the unique identifier for the Wazuh rule.level: The rule’s classification level ranges between 0 and 15. According to the rule categories page (https://documentation.wazuh.com/current/user-manual/ruleset/rules-classification.html) in the Wazuh documentation, each number indicates a distinct value and severity.if_sid: This specifies the ID of another rule (in our case, it’s 60009), which triggers the current rule. The “if” condition is considered as the “parent” rule that must be checked first.field name: This specifies the name of the field extracted from the decoder. The value is matched by a regular expression. In this case, we are looking for the field name win.system.providerName with a value of PowerShell.group: This is used to organize the Wazuh rules. It contains the list of categories that the rules belong to. We have organized our rule in the windows_powershell group.
There are tons of other options available for Wazuh rules. I would suggest you check out the Rules Syntax page at the following link: https://documentation.wazuh.com/current/user-manual/ruleset/ruleset-xml-syntax/rules.html) in the Wazuh documentation.
CDB lists
The Constant Database (CDB) list enables the categorization and management of IP addresses and domains based on their characteristics. These lists can include known malicious IP addresses, suspicious domains, trusted IP addresses, whitelisted domains, and more. Admins maintain these lists by adding or removing entries based on reputation or risk levels. To learn more about CDB lists, you can visit the official Wazuh documentation for CDB lists: https://documentation.wazuh.com/current/user-manual/ruleset/cdb-list.html.
Groups
Agents can be grouped based on their OS or functionalities using groups; for example, all Windows agents can be grouped under a single group named Windows Agents. This is helpful when you want to push configuration changes from the Wazuh manager to all Windows agents at once. This becomes a simple and single-step solution. To learn more about grouping agents, you can visit the official Wazuh documentation here: https://documentation.wazuh.com/current/user-manual/agents/grouping-agents.html.
Configuration
This helps security teams to fine-tune Wazuh’s main configurations such as cluster configuration, alert and output management, log data analysis, cloud security, vulnerabilities, inventory data, active response, commands, Docker listeners, and monitoring (Amazon S3, Azure logs, Google Cloud, GitHub, Office 365, etc.). All these features can even be customized from the command-line option as well. You need to locate the ossec.conf file in your Wazuh manager or Wazuh agent at the /var/ossec/etc directory.
Now, let’s start deploying our Wazuh agent on the Ubuntu machine and then we will install Suricata on the same machine.
Installing the Wazuh server
The Wazuh server is the central component of the Wazuh security platform. It consists of two important elements: the Wazuh manager and Filebeat. The Wazuh manager collects and analyzes data from the Wazuh agents and triggers alerts when it detects any threats. Filebeat forwards alerts and events to the Wazuh indexer. The Wazuh server can be installed in multiple ways, however, I’d recommend the multi-node cluster method for a production environment and the VM method for a lab environment. You can follow the guidelines for both methods in the following sections.
For a production environment
To set up Wazuh in the production environment, it is recommended to deploy the Wazuh server and Wazuh indexer on different hosts. This helps you handle traffic from a large number of endpoints and also to achieve high availability. The step-by-step guide to install the Wazuh server along with the indexer and dashboard is mentioned here: https://documentation.wazuh.com/current/installation-guide/index.html.
For a lab environment
You can use the Wazuh VM OVA file for a lab environment as it is easy to deploy. All the Wazuh components including the Wazuh server, indexer, and dashboard are unified. To install Wazuh using an OVA file, follow these steps:
- Download the OVA file: Start by downloading the Wazuh OVA file from the official Wazuh website: https://documentation.wazuh.com/current/deployment-options/virtual-machine/virtual-machine.html.
- Import the OVA file: Use your favorite virtualization platform (e.g., VMware Workstation, VirtualBox, etc.) and import the downloaded OVA file.
- Configure VM settings: Before powering on the VM, adjust the VM settings as needed:
- CPU cores: 4
- RAM: 8 GB
- Storage: 50 GB
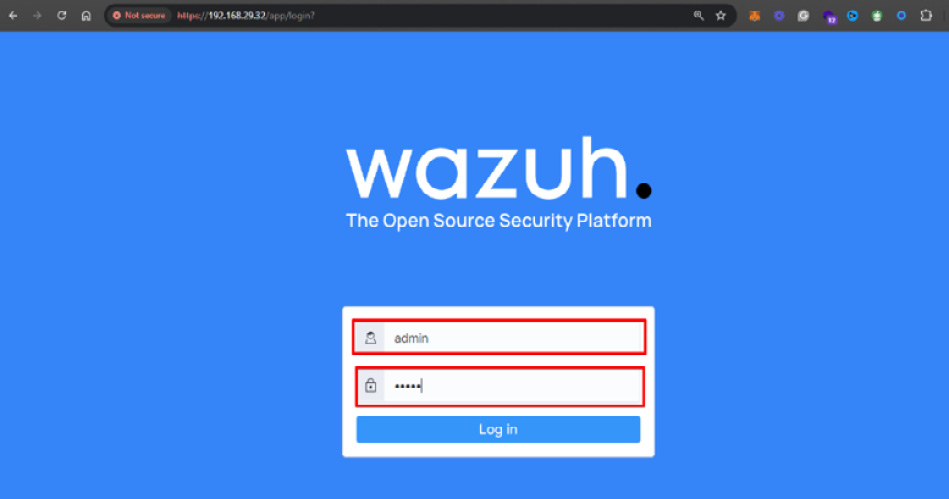
- Access the Wazuh web interface: You can start the VM. Next, open the Web browser using the VM IP address and enter the default username and password as shown in the diagram.
Figure 1.8 – Accessing the Wazuh web interface
You need to enter the following:
- Username:
admin
- Password:
admin
Installing Wazuh agent
A Wazuh agent is compatible with multiple OSs. Once a Wazuh agent is installed, it will communicate with the Wazuh server, pushing information and system logs in real-time using an encrypted channel.
Installing a Wazuh agent on Ubuntu Server
To deploy a Wazuh agent on the Ubuntu Server, you need to install the agent and configure the deployment variables. To get started with installation, you need to log in to your Wazuh dashboard, navigate to Agents, click on Deploy an agent and then follow these steps:
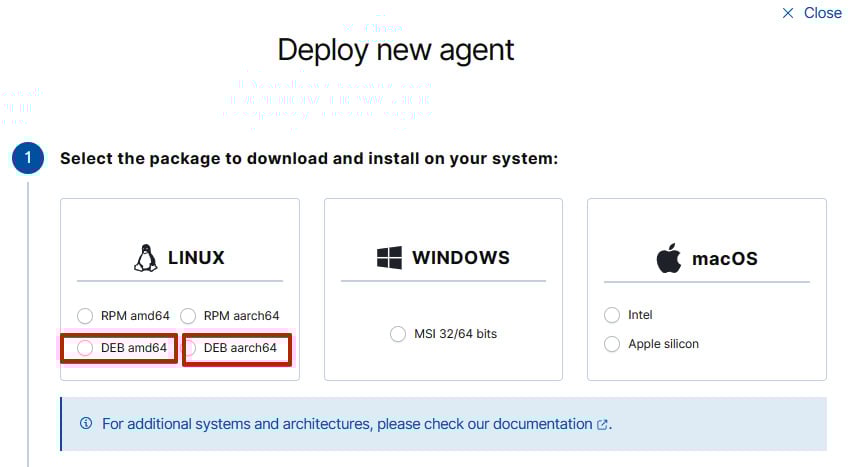
- Select an OS, version, and architecture: As mentioned in the following diagram, navigate to the LINUX box and choose DEB amd64 for AMD architecture or DEB aarch64 for ARM architecture.
Figure 1.9 – Deploying a new agent
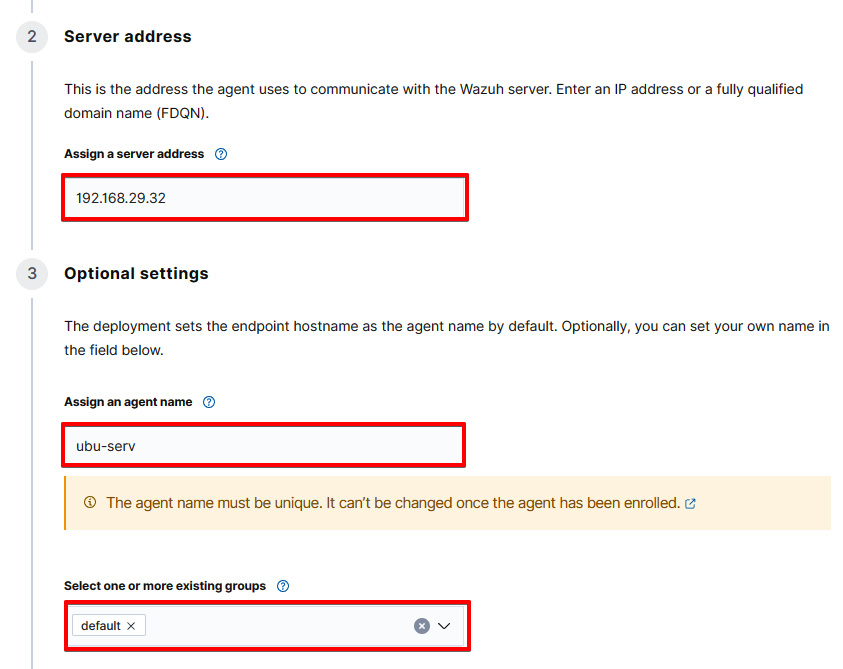
- Enter the server address and other optional settings: Enter the Wazuh server address and agent name and select the group. Please make sure your desired agent group is created before you add any new agent.
Figure 1.10 – Choosing a server address and optional settings
Let’s break down what we’ve inputted:
192.168.29.32: This is the IP address of the Wazuh serverubu-serv: This indicates the name of the Wazuh agentdefault: It represents the Wazuh agent group
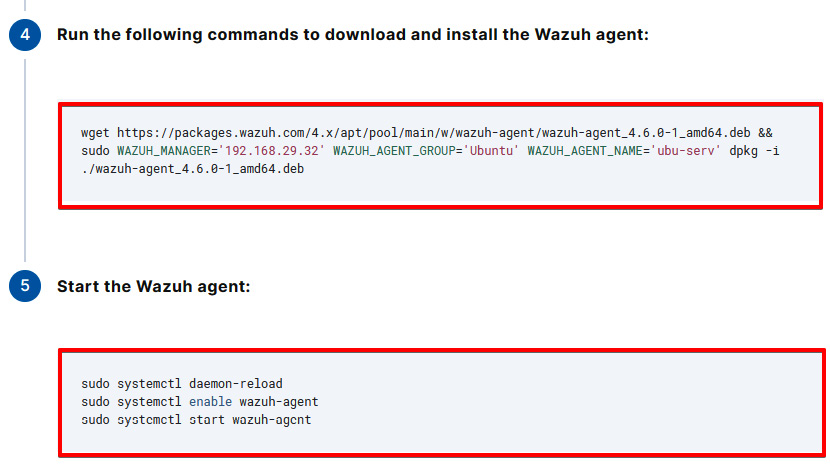
- Download the package and enable the service: Copy the
curl command to download the Wazuh module and start the Wazuh agent service as mentioned in the following diagram.
Figure 1.11 – Retrieving the commands to download and install a Wazuh agent
Note
Make sure that there are no firewall rules blocking communication between the agent and the Wazuh manager. The agent should be able to communicate with the manager over the configured port (the default is 1514/514 for syslog).
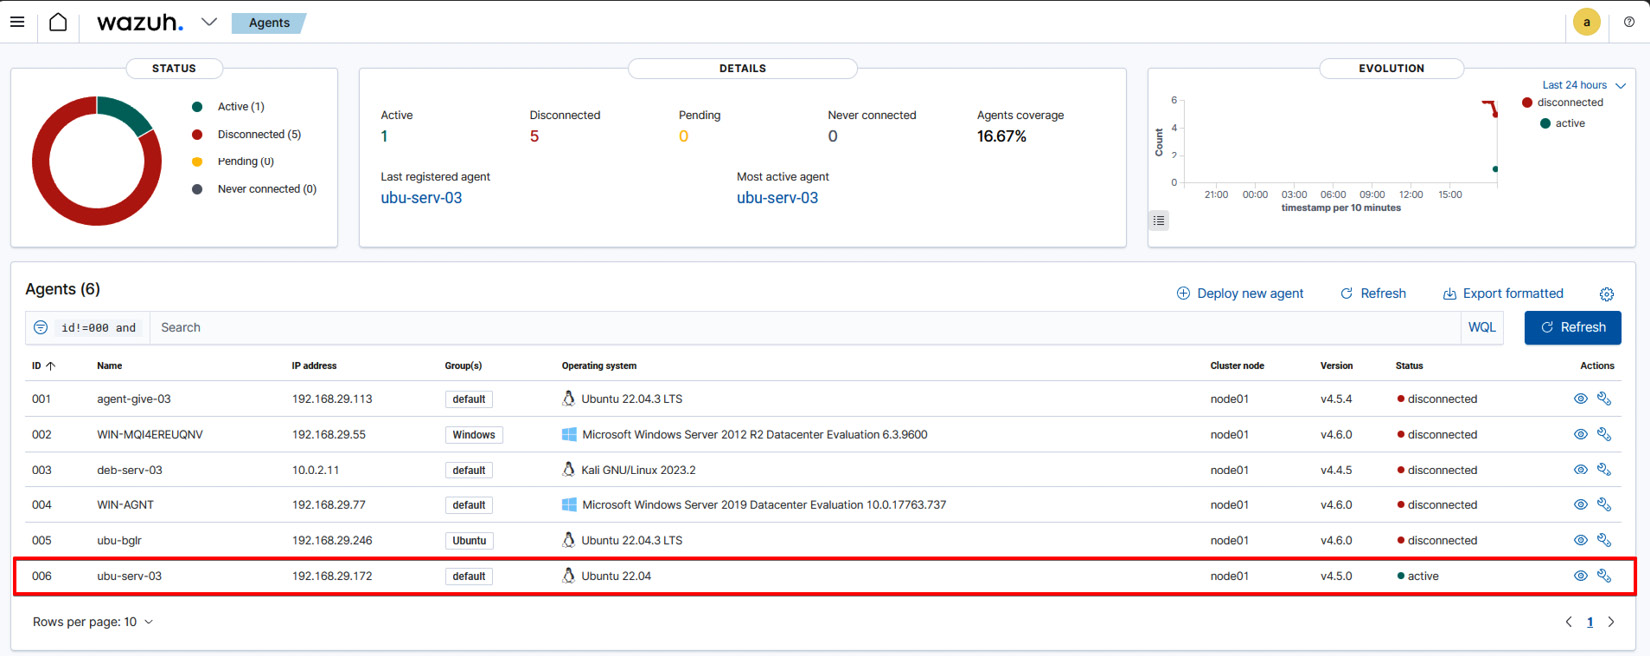
Finally, you can verify whether the agent is connected and activated by logging in to the Wazuh manager and navigating to Agents.
Figure 1.12 – Visualizing Wazuh agents
As you can see in the preceding diagram, the ubu-serv-03 agent is connected with the following:
- ID:
006
- IP address:
192.168.29.172
- Group(s): default
- Operating system: Ubuntu 22.04
- Status: active
Now, let’s install the Wazuh agent on Windows Server. The process will be the same for the Windows desktop, too.
Installing a Wazuh agent on Windows Server
You can monitor real-time events from Windows Server or a desktop on the Wazuh server by using the command line interface (CLI) or graphical user interface (GUI). To get started with installation, you need to log in to your Wazuh dashboard, navigate to Agents, click on Deploy an agent and then follow these steps:
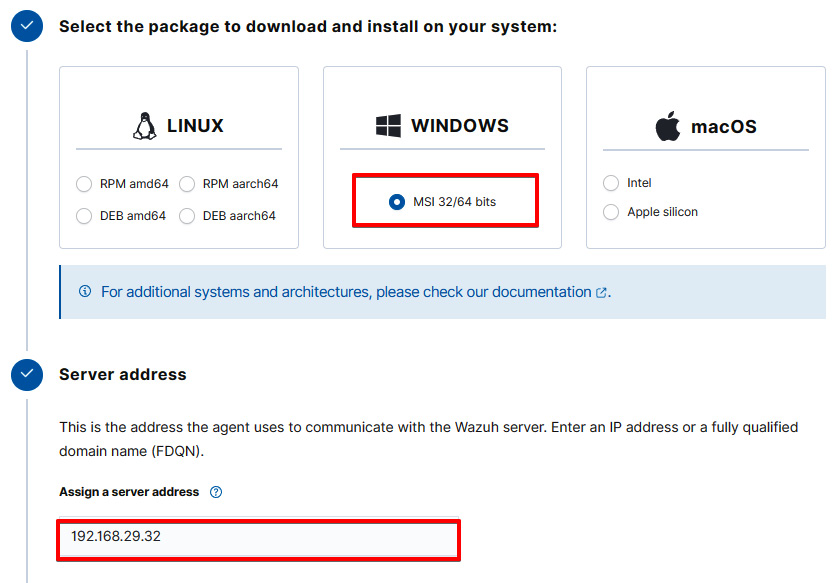
- Select an OS, version, and architecture: As shown in the following diagram, navigate to the WINDOWS box, choose the MSI 32/64 bits package, and then enter the Wazuh server IP address.
Figure 1.13 – Selecting the Windows package for the Wazuh agent
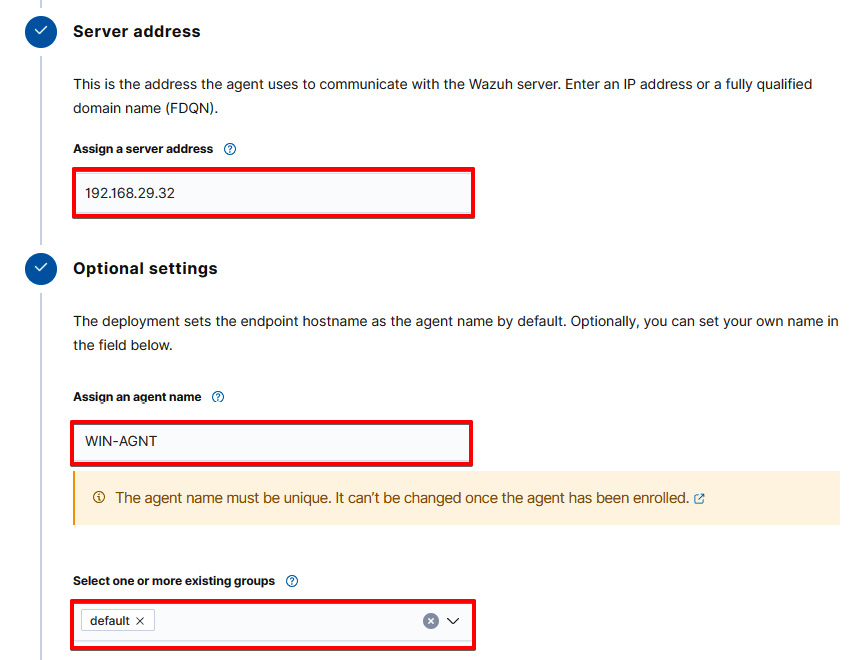
- Enter the server address and other optional settings: Enter the Wazuh server address and agent name and select the group. Please make sure your desired agent group is created before you add any new agent.
Figure 1.14 – Entering the server address and optional settings
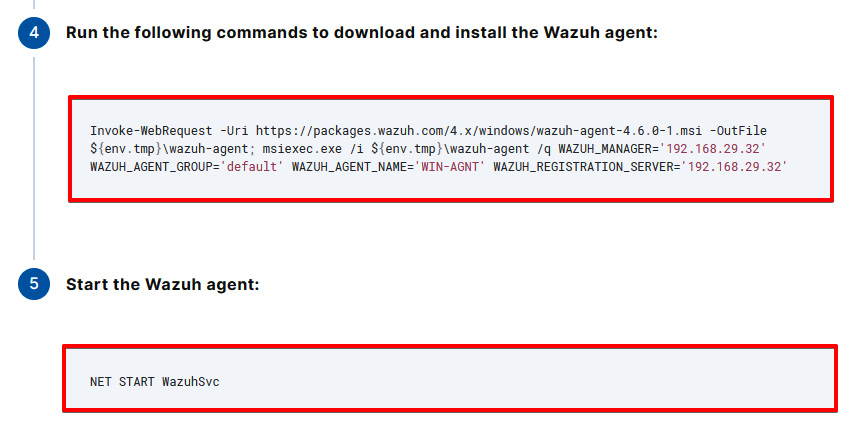
- Download the package and enable the service: Copy the PowerShell command to download the Wazuh module and start the Wazuh agent service as shown in the following diagram. The following command needs to be entered on a Windows PowerShell terminal.
Figure 1.15 – Retrieving the commands to download and install the Wazuh agent on a Windows machine
Finally, you can verify whether the agent is connected and activated by logging in to the Wazuh manager and navigating to Agents.
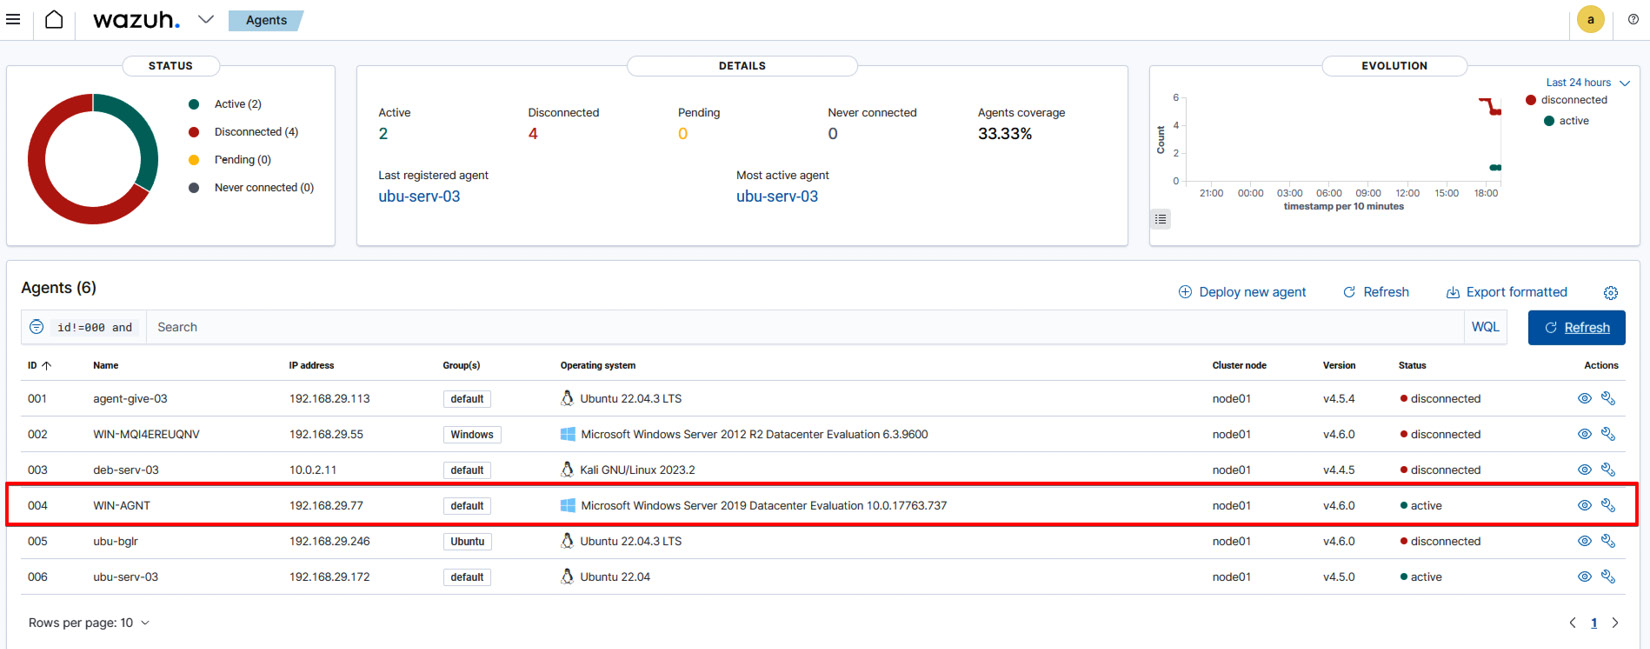
Figure 1.16 – Visualizing Wazuh agents installed on a Windows machine
As you can see in the preceding diagram, the WIN-AGNT agent is connected with the following:
- ID:
004
- IP address:
192.168.29.77
- Group(s): default
- Operating system: Microsoft Windows Server 2019 Datacenter Evaluation 10.0.17763.737
- Status: active
We have successfully learned how to deploy Wazuh agents on both the Ubuntu Server and Windows Server. In the next section, we will learn how to set up a Suricata IDS on Ubuntu Server.
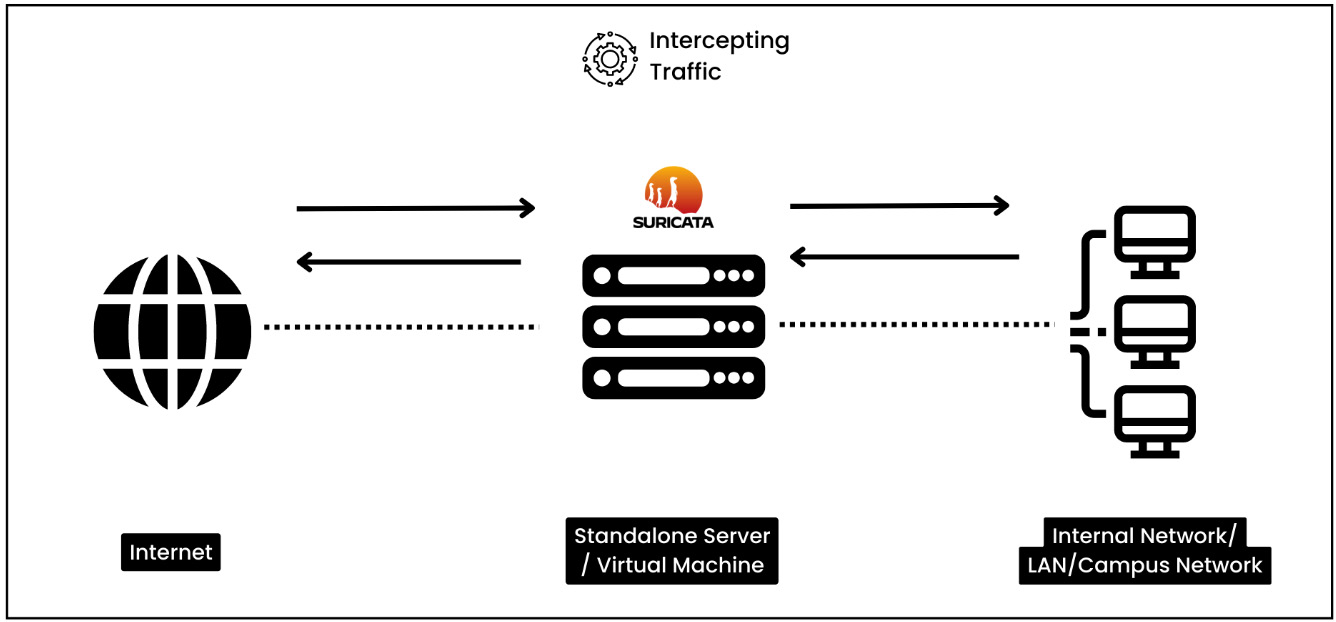
Installing Suricata on Ubuntu Server
With the ability to detect malicious or suspicious activities in real time, Suricata is an NSM tool, which has the potential to work as an IPS/IDS. Its goal is to stop intrusion, malware, and other types of malicious attempts from taking advantage of a network. In this section, we will learn how to install Suricata on Ubuntu server. Let’s first learn about the prerequisites.
Prerequisites
To install Suricata IDS on Ubuntu Server, the prerequisites are as follows:
- You will need to have Ubuntu Server installed (version 20.04 or higher)
- Sudo Privileges
Installation
This process involves the installation of Suricata packages using the apt-get command line tool and then we need to install the free and open source Suricata rules created by the ET community. The rules within the ET ruleset cover a broad spectrum of threat categories, including malware, exploits, policy violations, anomalies, botnets, and so on. To complete the installation, follow these steps:
- Install Suricata: Log in to the terminal on Ubuntu Server and install the Suricata IDS package with the following commands:
sudo add-apt-repository ppa:oisf/suricata-stable
sudo apt-get update
sudo apt-get install suricata –y
- Install the ET ruleset: Install the ET ruleset. The ET Suricata ruleset comprises a compilation of rules created for the Suricata IDS. We are required to store all the rules in the
/etc/suricata/rules directory:cd /tmp/ && curl -LO https://rules.emergingthreats.net/open/suricata-6.0.8/emerging.rules.tar.gz
sudo tar -xvzf emerging.rules.tar.gz && sudo mv rules/*.rules /etc/suricata/rules/
sudo chmod 640 /etc/suricata/rules/*.rules
Note
If the rule directory is not present, you can create one by using the mkdir /etc/suricata/ rules and then you can enter the previously mentioned commands.
- Modify the Suricata configuration: In order to fine-tune Suricata configuration, it is required to change the default setting under the Suricata configuration file located at
/etc/suricata/suricata.yaml:HOME_NET: "<AGENT_IP>"
EXTERNAL_NET: "any"
default-rule-path: /etc/suricata/rules
rule-files:
- "*.rules"
# Linux high speed capture support
af-packet:
- interface: eth01
Let’s break down this code further:
HOME_NET: This is a variable that needs to be set with the agent IP address.EXTERNAL_NET: This variable needs to be set with "any" to ensure Suricata will monitor the traffic from any external IP address.default-rule-path: This is set to our Suricata rule path.af-packet: This is a packet capture method used to capture network traffic directory from a network interface card (NIC). You can check your current NIC by using the ifconfig command and updating the af-packet settings.
- Restart the Suricata service: In order for configuration changes to take effect, we are required to restart the Suricata service using the following command:
$ sudo systemctl restart suricata
- Integrate with Wazuh: In order for the Wazuh agent to monitor and collect Suricata traffic, we need to specify the Suricata log file location under the Wazuh agent
ossec config file located at /var/ossec/etc/ossec.conf. Suricata stores all the logs at /var/log/suricata/eve.json. You are required to mention this file under the <location> tag in the ossec.conf file:<ossec_config>
<localfile>
<log_format>json</log_format>
<location>/var/log/suricata/eve.json</location>
</localfile>
</ossec_config>
- Restart the Wazuh agent service: For the current changes to take effect, you need to restart the Wazuh agent services using the following command:
$ sudo systemctl restart wazuh-agent
This completes Suricata’s integration with Wazuh. The Suricata IDS has been installed on Ubuntu Server along with the ET ruleset. Your endpoints are ready to trigger alerts if any malicious traffic is matched against any of the ET rulesets. Before getting into some practical use cases, let’s first get a basic understanding of Suricata rules and how to create one.
 Argentina
 Australia
 Austria
 Belgium
 Brazil
 Bulgaria
 Canada
 Chile
Chile
 Colombia
 Cyprus
 Czechia
 Denmark
 Ecuador
 Egypt
Egypt
 Estonia
 Finland
 France
 Germany
 Great Britain
 Greece
 Hungary
 India
India
 Indonesia
 Ireland
 Italy
Italy
 Japan
Japan
 Latvia
 Lithuania
 Luxembourg
 Malaysia
 Malta
Malta
 Mexico
 Netherlands
 New Zealand
 Norway
 Philippines
 Poland
 Portugal
 Romania
 Russia
 Singapore
 Slovakia
 Slovenia
 South Africa
 South Korea
 Spain
Spain
 Sweden
 Switzerland
 Taiwan
 Thailand
 Turkey
 Ukraine
 United States