Connecting to Data in Tableau
Tableau offers the ability to connect to nearly any data source. It does this with a unique paradigm that leverages the power and efficiency of existing database engines (for example, Snowflake or SQL Server) or alternatively extracts the data locally.
We’ll look at relating tables of data together using joins, blends, unions, and the object model in Chapter 14, Understanding the Tableau Data Model, Joins, and Blends. In this chapter, we’ll focus on essential concepts of how Tableau connects to and works with data more broadly. We’ll cover the following topics:
- The Tableau paradigm
- Connecting to data
- Managing data source metadata
- Working with extracts instead of live connections
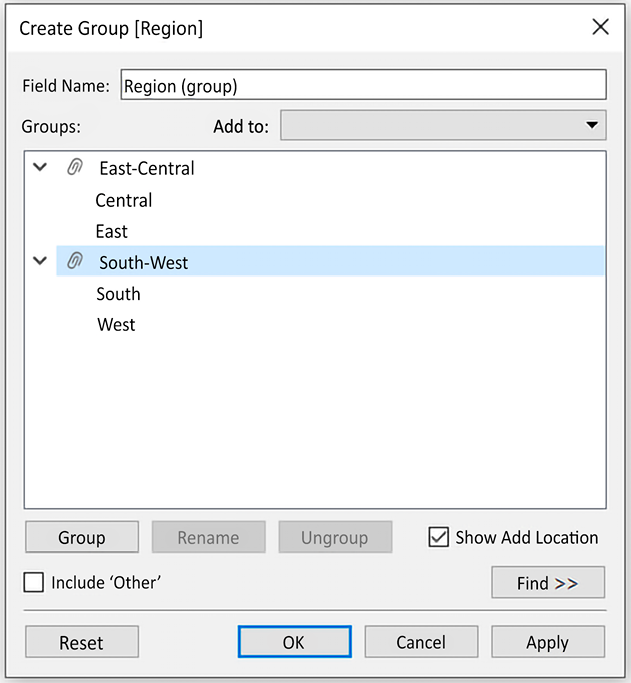
- Using sets and groups
- Filtering data
We’ll start by gaining an understanding of the underlying paradigm of how Tableau works with data.