Search icon
Subscription
0
Cart icon
Close icon
You have no products in your basket yet
Arrow left icon
All Products
Best Sellers
New Releases
Books
Videos
Audiobooks
Learning Hub
Newsletters
Free Learning
Arrow right icon
Python Real-World Projects

You're reading from  Python Real-World Projects

Product type Book
Published in Sep 2023
Publisher Packt
ISBN-13 9781803246765
Pages 478 pages
Edition 1st Edition
Languages
Author (1):
Steven F. Lott Steven F. Lott
Profile icon Steven F. Lott

Table of Contents (20) Chapters

Preface 1. Chapter 1: Project Zero: A Template for Other Projects 2. Chapter 2: Overview of the Projects 3. Chapter 3: Project 1.1: Data Acquisition Base Application 4. Chapter 4: Data Acquisition Features: Web APIs and Scraping 5. Chapter 5: Data Acquisition Features: SQL Database 6. Chapter 6: Project 2.1: Data Inspection Notebook 7. Chapter 7: Data Inspection Features 8. Chapter 8: Project 2.5: Schema and Metadata 9. Chapter 9: Project 3.1: Data Cleaning Base Application 10. Chapter 10: Data Cleaning Features 11. Chapter 11: Project 3.7: Interim Data Persistence 12. Chapter 12: Project 3.8: Integrated Data Acquisition Web Service 13. Chapter 13: Project 4.1: Visual Analysis Techniques 14. Chapter 14: Project 4.2: Creating Reports 15. Chapter 15: Project 5.1: Modeling Base Application 16. Chapter 16: Project 5.2: Simple Multivariate Statistics 17. Chapter 17: Next Steps 18. Other Books You Might Enjoy 19. Index

15.5 Extras

Here are some ideas for you to add to this project.

15.5.1 Measures of shape

The measurements of shape often involve two computations for skewness and kurtosis. These functions are not part of Python’s built-in statistics library.

It’s important to note that there are a very large number of distinct, well-understood distributions of data. The normal distribution is one of many different ways data can be distributed.

See https://www.itl.nist.gov/div898/handbook/eda/section3/eda366.htm.

One measure of skewness is the following:

 ∑(Y− ¯Y)3 ----iN---- g1 = s3

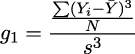
Where Ȳ is the mean, and s is the standard deviation.

A symmetric distribution will have a skewness, g1, near zero. Larger numbers indicate a ”long tail” opposite a large concentration of data around the mean.

One measure of kurtosis is the following:

 ∑ (Y −Y¯)4 ---iN----- kurtosis = s4

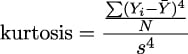
The kurtosis for the standard normal distribution is 3. A value larger than 3 suggests more data is in the tails; it’s ”flatter” or ”...

lock icon The rest of the chapter is locked
Register for a free Packt account to unlock a world of extra content!
A free Packt account unlocks extra newsletters, articles, discounted offers, and much more. Start advancing your knowledge today.
Unlock this book and the full library FREE for 7 days
Get unlimited access to 7000+ expert-authored eBooks and videos courses covering every tech area you can think of
Renews at €14.99/month. Cancel anytime}