Chapter 4. Using Row-Level, Aggregate, and Level of Detail Calculations
One of the most incredible things about Tableau is that it is intuitive to use. We have already seen what amazing discovery, analysis, and data storytelling is possible in Tableau by simply connecting to data and dragging and dropping fields. As we'll see, Tableau allows much more depth beyond simple drag and drop.
Calculations significantly extend the possibilities for analysis, design, and interactivity in Tableau. In this chapter, we'll see how calculations can be used in many ways. We will examine how calculations can be used to fix common problems with data, extend the data by adding new dimensions and measures, and provide additional flexibility in interactivity.
At the same time, while calculations provide additional power and flexibility, they also introduce a level of complexity and sophistication. As you work through this chapter, try to understand the key concepts behind calculations and how they work in Tableau...
Creating and editing calculations
A calculation is often referred to as a calculated field in Tableau. This is because, when you create a calculation, it will either show up as a new measure or a dimension in the data pane (unless it is an ad hoc calculation). Calculations consist of code that references other fields, parameters, constants, groups, or sets, and use combinations of functions and operations to achieve a result. Sometimes this result is per row of data and sometimes it is done at an aggregate level. We'll consider the difference shortly.
There are multiple ways to create a calculated field in Tableau:
Navigate to Analysis | Create Calculated Field... from the menu.
Use the drop-down menu next to Dimensions in the data pane:
Right-click an empty area in the data pane and select Create Calculated Field.
Use the drop-down menu on a field, set, or parameter in the data pane and select Create | Calculated Field....
In Tableau 9.0 or later, double-click an empty area on the Rows, Columns...
Overview of the three main types of calculations
The groupings of functions mentioned in the preceding section are important for understanding what kind of functionality is possible. However, the most fundamental way to understand calculations in Tableau is to think of the three different levels of calculations:
Row Level calculations: These calculations are performed for every row of underlying data. For example, you might calculate the number of days between the start date and end date. The resulting value would be calculated and available for each row of data.
Aggregate Level calculations: These calculations are performed at an aggregate level. The view level of detail is defined by fields used as dimensions in the view. You might add or change the dimension in the view, and the Aggregate calculation will be re-calculated to give the result at the new view level of detail.
Table calculations: These calculations are performed at an aggregate level on the table of aggregate data, which...
Level of Detail calculations
Level of Detail calculations (sometimes abbreviated as LoD calcs or LoD expressions) are a special kind of calculation that allow you to perform aggregations at a specified level of detail, which may be different from the level of detail defined in the view, and then work with the resulting value at a row level. In this way, you can think of LoD calculations as a hybrid between Row Level calculations and Aggregate Row Level calculations.
Level of Detail calculations follow this basic pattern of syntax:
{[TYPE] [Dimension 1],[Dimension 2] : AGG([Measure])}
The parts of the preceding declaration are as follows:
TYPE: Is the type of LoD calculation (FIXED, INCLUDE, or EXCLUDE), which are described in detail in the following section.
Dimension 1, Dimension 2: Is a comma-separated list of dimension fields that define the level of detail at which the calculation will be performed. You may use any number of dimensions to define the level of...
Before moving to some additional examples of Row Level and Aggregate Level calculations, let's take a little side trip to examine parameters, as they can be used in incredible ways in calculations.
A parameter in Tableau is a place-holder for a single global value, such as a number, date, or string. Parameters may be shown as controls (such as sliders, drop-down lists, or type-in text boxes) to end users of dashboards or views, giving them the ability to change the current value of the parameter. The value of a parameter is global, so that if the value is changed, every view and calculation in the workbook that references the parameter will use the new value. Parameters provide another way to provide rich interactivity to end-users of your dashboards and visualizations.
Parameters can be used to allow anyone interacting with your view or dashboard to dynamically do many things, including the following:
Practical examples of calculations and parameters
Let's turn our attention to some practical examples of calculations. These will be examples of Row Level and Aggregate Level calculations. These are merely examples. The goal is to learn and understand some of what is possible with calculations. You will be able to build on these examples as you embark on your analysis and visualization.
Often, data is not entirely clean. That is, it has problems that need to be corrected before meaningful analysis can be accomplished. For example, dates may be incorrectly formatted or fields may contain a mix of numeric values and character codes that need to be separated into multiple fields. We'll look in depth at many ways of working with messy data in Chapter 9, Making Data Work for You. Here, we'll consider how calculated fields can often...
Ad hoc calculations add calculated fields to shelves in a single view without adding fields to the data pane.
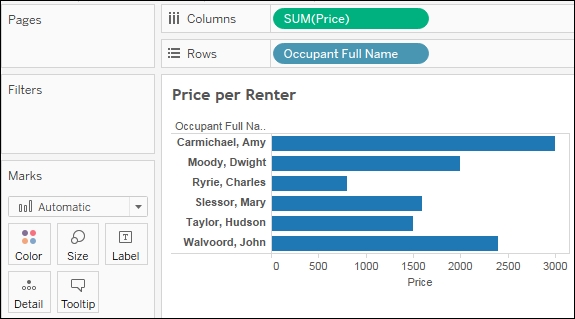
Let's say that you have a simple view, which shows the Price per Renter, as shown:
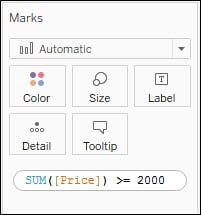
What if you want to quickly highlight any renters who had a contract of at least $2000? One option would be to create an ad hoc calculation. To do so, simply double-click on an empty area of the Columns, Rows, or Measure Values cards, or on the empty space of the Marks shelf, and then start typing the code for a calculation. In this example, we've double-clicked on the empty space on the Marks shelf:
Here, we've entered code that will return True if the sum of Price is at least $2000 and False otherwise. Pressing
Enter
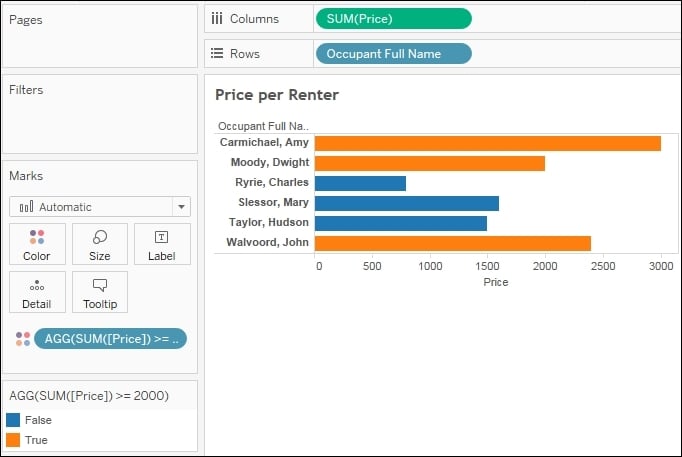
or clicking outside the text box will reveal a new ad hoc field that can be dragged and dropped anywhere within the view. Here, we've added it to the Color shelf:
The ad hoc field is only available within the view and does not show up in the data pane. You can...
Performance considerations
When working with a small dataset and an efficient database, you often won't notice inefficient calculations. With larger datasets, the efficiency of your calculations can start to make a fairly dramatic difference to the speed at which a view is rendered.
Here are some tips for getting the most efficiency in your calculations:
Boolean and numeric calculations are faster than string calculations. If possible, avoid string manipulation and use aliasing or formatting to provide user-friendly labels. For example, don't write this code: IF [value] == 1 THEN "Yes" ELSE "No" END. Instead, simply write [value] == 1 and then edit the aliases of the field and set True to "Yes" and False to "No".
Always look for ways to increase the efficiency of a calculation. If you find yourself writing a long IF...ELSEIF statement with lots of conditions, see if there are one or two conditions that you can check first to eliminate checks of all the other conditions. For example, let's consider...
Calculations open up amazing possibilities in Tableau. You are no longer confined to the fields in the source data. With calculations, you can extend the data by adding new dimensions and measures, fix bad or poorly, formatted data, enhance the user experience with parameters for user input and calculations that enhance the visualizations, and you can achieve flexibility that makes data blending work in situations where the data might have made it difficult or impossible otherwise.
The key to using calculated fields is an understanding of the three levels of calculations in Tableau. The Row Level calculations are performed for every row of source data. These calculated fields can be used as dimensions or they can be further aggregated as measures. Aggregate Level calculations are performed at the level of detail defined by the dimensions present in a view. They are especially helpful, and even necessary, when you must first aggregate components of the calculation before performing...