Reader small image

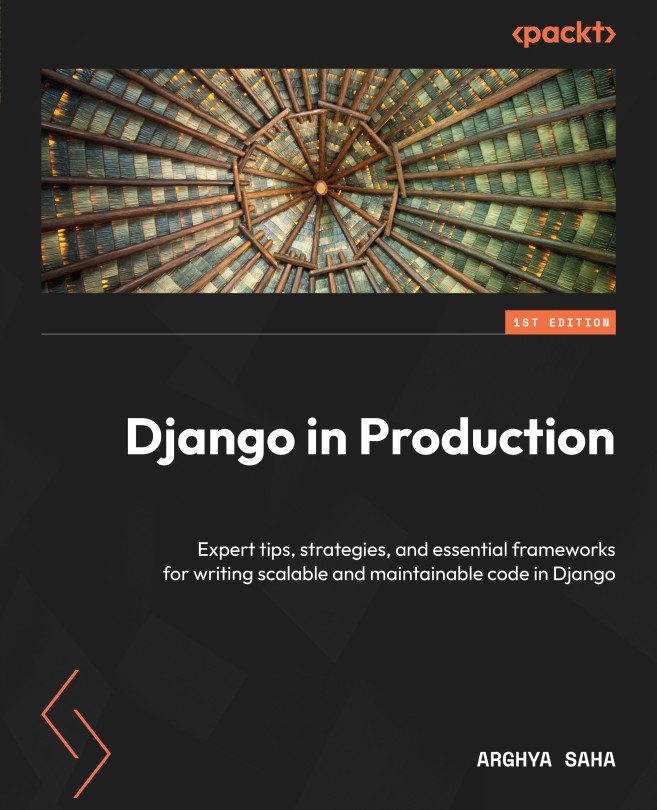
You're reading from  Django in Production

Product typeBook
Published inApr 2024
Reading LevelIntermediate
PublisherPackt
ISBN-139781804610480
Edition1st Edition
Languages
Tools
Right arrow
Author (1)
Arghya Saha
Arghya Saha
author image
Arghya Saha

Arghya (argo) Saha, is a software developer with 8+ years of experience and has been working with Django since 2015. Apart from Django, he is proficient in JavaScript, ReactJS, Node.js, Postgres, AWS, and several other technologies. He has worked with multiple start-ups, such as Postman and HealthifyMe, among others, to build applications at scale. He currently works at Abnormal Security as a senior Site Reliability Engineer to explore his passion in the infrastructure domain. In his spare time, he writes tech blogs. He is also an adventurous person who has done multiple Himalayan treks and is an endurance athlete with multiple marathons and triathlons under his belt.
Read more about Arghya Saha

Right arrow

Monitoring Django Application

In Chapter 13, we learned how to deploy a Django application to AWS and run code in production. Now comes the last and most important part of application development – monitoring and maintenance.

Developing an application is the first step of product development. Users will use a product only when there is enough trust in the product. The first step toward establishing trust in a product is making the product stable. To achieve stability in our application, we need to have a good monitoring system and reduce errors and downtime. We shall learn how to use different tools to monitor our Django application.

In this chapter, we shall cover the following topics:

  • Integrating error monitoring tools into a Django application
  • Integrating uptime monitoring tools into a Django application
  • Integrating APM tools into a Django application
  • Integrating messaging tools into the development process
  • Handling production incidents better...
Technical requirements

In this chapter, we shall focus on integrating different third-party tools into our Django application. We expect you to be well-versed in the concepts discussed in the previous chapters. You should have basic knowledge of exception/error monitoring and Application Performance Monitoring (APM) tools and how they can be used to improve the stability and performance of applications. You are also expected to know about the basic concepts of uptime monitoring and should be using messaging tools such as Slack/Teams.

Here is the GitHub repository that has all the code and instructions for this chapter: https://github.com/PacktPublishing/Django-in-Production/tree/main/Chapter14

Integrating error monitoring tools

When we develop an application, developers will try to handle all the corner cases and write as much error-free code as possible. But, somehow, a few corner cases will be missed. A few errors will always slip by, and users will see occasional errors while using the service. These application errors are occasional, but it’s important to address them to have a stable application. While working on a local development setup, these errors can be easily detected in the terminal. But when we move to production, it becomes difficult to detect these errors. A lot of beginners still use logs to detect raised exceptions. Error monitoring tools are lifelines to detect any production exceptions raised.

Tools such as Sentry, Rollbar, BugSnag, and so on are error/exception monitoring tools that help us track and fix exceptions raised in production. In this chapter, we shall use Rollbar (https://rollbar.com/) and integrate it into our Django project.

...

Integrating uptime monitoring

Would you use an application that frequently goes down? No. When you create an application and users are using it, you need to make sure your service has maximum availability. The uptime SLA is crucial for every service to establish trust among users. In this section, we shall learn how we can monitor the uptime of our Django application by adding a health check endpoint to our automated monitoring system.

Adding a health check endpoint

django-health-check (https://github.com/revsys/django-health-check) is a third-party package that can be easily added to any Django project to create an endpoint that can be monitored for uptime. Let us learn how to integrate django-health-check into the Django project. To do so, follow these steps:

  1. Install django-health-check in our Django project by using the following code in our terminal:
    pip install django-health-check
  2. Now add health_check to Django INSTALLED_APPS in the settings.py file:
    INSTALLED_APPS...

Integrating APM tools

Suppose we develop, test, and optimize our application on our local development setup. Now, when we deploy our changes to production, everything is working fine, but suddenly, after a week, users complain about slow response times and panic mode starts. What do we do now? How do we debug the reason for degraded performance in production? To solve this problem, we use APM tools such as New Relic.

APM tools help us identify all performance bottlenecks and root causes of them. Degraded performance can be due to a badly written DB query, badly written application code, or maybe a higher number of user requests. Whatever the reason, APM tools can help us identify the issues and guide us to the right root cause with less guesswork and more data-driven conclusions.

There are different APM tools available, such as New Relic, DataDog, Chronosphere, Splunk, and so on. We shall learn about New Relic in this book, but you can easily follow the official documentation...

Integrating messaging tools using Slack

In today’s software development world, messaging tools such as Slack/Teams are an integral part of the development cycle. In this section, we shall take Slack (https://slack.com/) as an example and show how software developers can take advantage of such communication tools to improve their productivity and enhance monitoring.

In the Integrating Rollbar with Slack and Creating New Relic alert conditions sections, we showed how we can integrate Slack into error monitoring tools, uptime monitoring tools, and APM tools. This way, developers do not have to go to all applications individually to keep track of whether an alert is triggered or not. Rather, whenever there is an alert, the tool will automatically message on Slack and developers access the details from Slack directly.

Slack provides a rich message interface, so users can not only respond to messages but also take action without leaving Slack. For example, when Rollbar notifies...

Handling production incidents better

Every on-call engineer’s nightmare is getting a call in the middle of the night about production systems being down. Production incidents are common in every company, be it a two-engineer start-up or a 20,000-engineer big tech organization such as Google. An incident is defined as an event that causes disruption or degraded performance to the end user using a service. In the Integration APM tools section, we learned how to use APM tools to identify degraded performance and how to use uptime monitoring tools to identify any downtime and alert stakeholders. Now let us learn how to work during an incident and how to manage things better.

The first job of an on-call engineer is to make sure they don’t panic. Contrary to common opinion, I have observed that engineers who do not take incidents as a “do or die situation” can handle incidents much better. It is very difficult to have a generic approach to solving production...

Blameless RCA for incidents

RCA can be defined as a systematic method to uncover the fundamental cause of an incident through a series of “why?” questions until no further diagnostic information can be extracted. The most important part of conducting an RCA is being blameless. In this section, we shall learn how to create a blameless RCA for incidents that would help in creating a strong and healthy engineering culture in the team during RCAs.

Let us learn about a few important pointers that can help us create a blameless RCA:

  • Focus on what went well during the incident: Highlighting the positive points that went well during the incident gives more confidence to the team. Thank the on-call engineers who responded to the incident and did the firefighting.
  • Focus on the future: Do not focus on what could’ve happened, should’ve happened, or any past events. Rather, focus on what actions we can take to improve for next time or avoid it happening...

Summary

In this chapter, we have learned how to work with different tools to monitor and improve our application. APM tools such as New Relic help in application performance monitoring, which is critical for any application. We learned how to integrate New Relic into our Django application. Getting 5xx errors in production is every developer’s nightmare, and error monitoring tools such as Rollbar and Sentry help in capturing and tracking bugs so that developers can fix them easily. We have also learned in this chapter how to integrate uptime monitoring tools that continuously monitor our application and inform us immediately if there is downtime.

It is important to know that in today’s application development process, writing code is the first part, and using the right tools for maintenance and communication is crucial. With so many third-party tools, it can be overwhelming for developers and other engineering leaders to track every tool, hence unifying all the communication...

lock icon
The rest of the chapter is locked
You have been reading a chapter from
Django in Production
Published in: Apr 2024Publisher: PacktISBN-13: 9781804610480
Register for a free Packt account to unlock a world of extra content!
A free Packt account unlocks extra newsletters, articles, discounted offers, and much more. Start advancing your knowledge today.
undefined
Unlock this book and the full library FREE for 7 days
Get unlimited access to 7000+ expert-authored eBooks and videos courses covering every tech area you can think of
Renews at €14.99/month. Cancel anytime

Author (1)

author image
Arghya Saha

Arghya (argo) Saha, is a software developer with 8+ years of experience and has been working with Django since 2015. Apart from Django, he is proficient in JavaScript, ReactJS, Node.js, Postgres, AWS, and several other technologies. He has worked with multiple start-ups, such as Postman and HealthifyMe, among others, to build applications at scale. He currently works at Abnormal Security as a senior Site Reliability Engineer to explore his passion in the infrastructure domain. In his spare time, he writes tech blogs. He is also an adventurous person who has done multiple Himalayan treks and is an endurance athlete with multiple marathons and triathlons under his belt.
Read more about Arghya Saha