


Using shapes as cards in your dashboards
After setting the stage with our mockup, we will now bring in the first element of our dashboard: a card that displays the calculations for revenue, cost, profit, and profit margin.
Before we proceed with this, let’s quickly go over these calculations.
We will switch to the Calculations sheet.
The calculations for these metrics can be done using PivotTables or cube functions. Both options have advantages and disadvantages. Let’s look at both options.
To use PivotTables, follow this process:
- Select any cell, preferably cell B3.
- Go to Insert > PivotTable > Data Model.
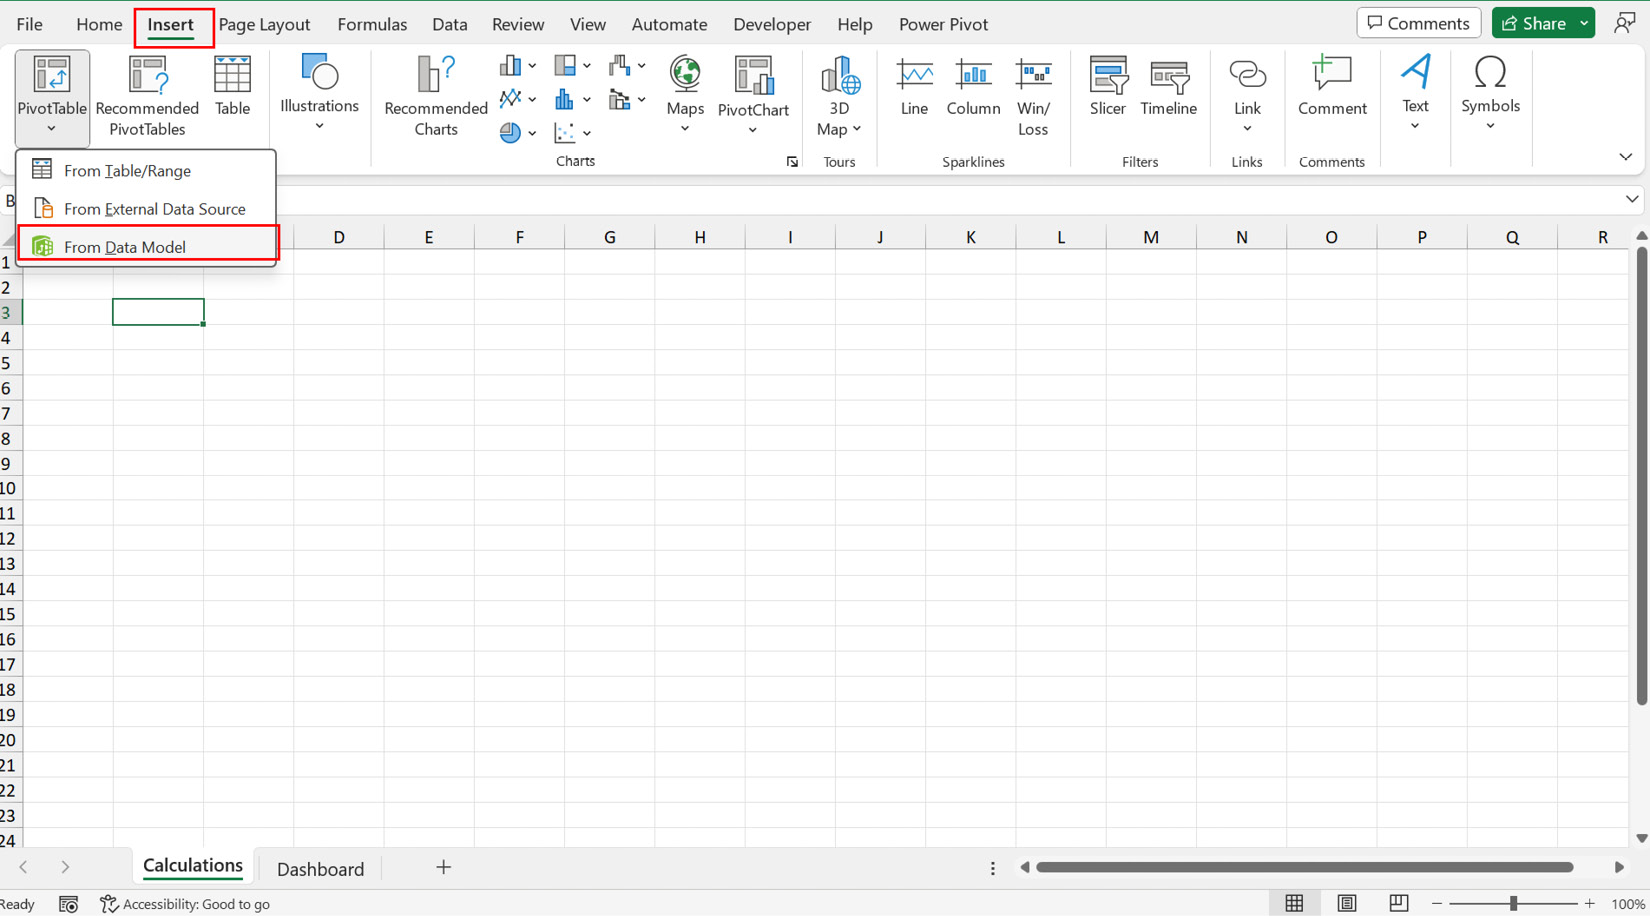
Figure 8.11 – Inserting a PivotTable from a data model


