


Now that we have created a device in the system, it is time to create some graphs for this device. You can jump to creating a graph from two different places: select New Graphs under Create or if you are still in editing mode of the device, click Create Graph for this Host. After clicking the option, you can see a form like the following. You might have different options based on which device/host you choose from the drop-down box.
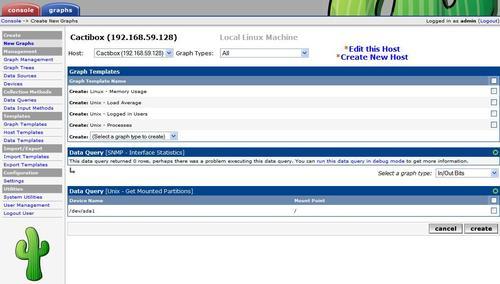
In this example, I am creating a graph for the CactiBox itself. So, you are not seeing some options in the Data Query section. We will see that section when we create a graph for a network interface. It's pretty much straight forward to create a graph for a device. You just need to check the option next to different rows that are shown in the Graph Templates and Data Query sections. After checking the options, click on the Create button. You will see another form where you can choose Legend Color and some additional options, if...


