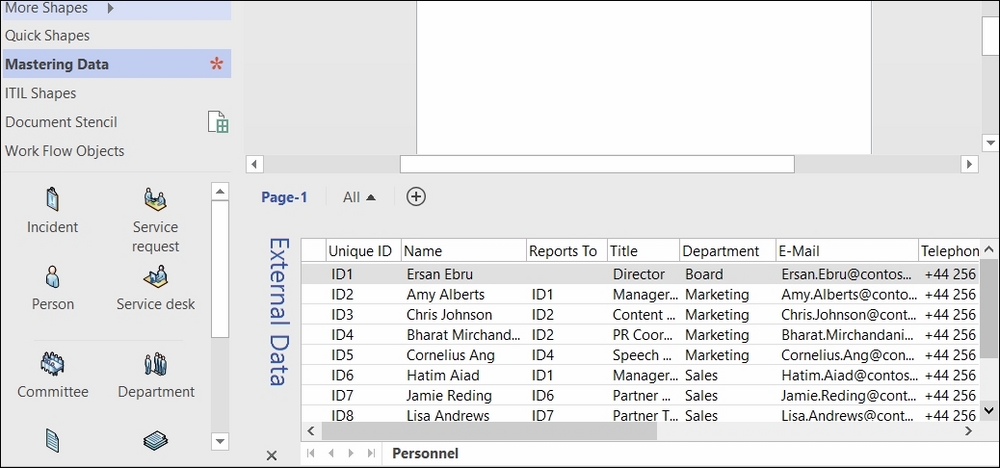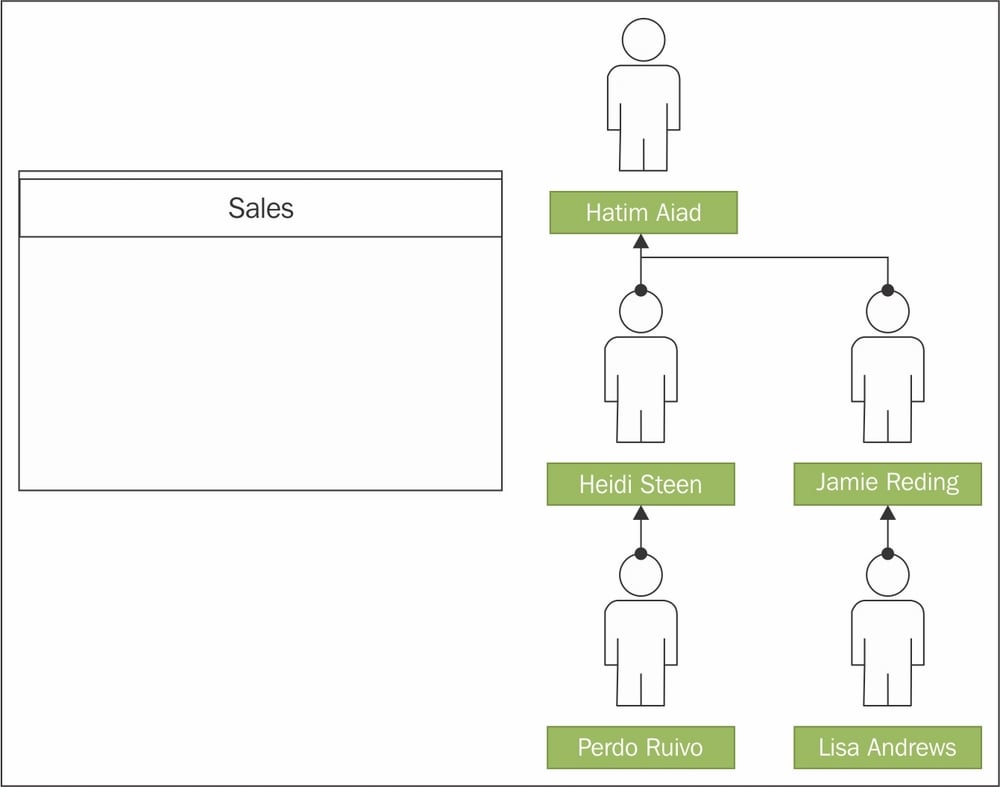

In the previous chapters, we learnt how to import data and display information graphically, and even how to validate the structure of a diagram. However, there are many scenarios when generating all or part of a diagram from data can save hours of manual layout work. In this chapter, we will look into ways of generating structured diagrams from data. This will include dropping specific shapes for specific data values, connecting shapes together, and placing them into containers and lists. Finally, we will learn how to associate callouts with shapes.
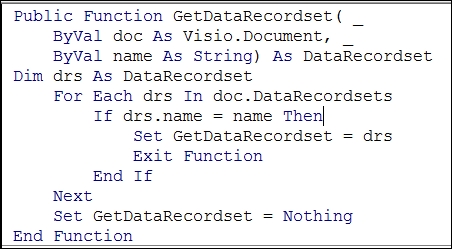
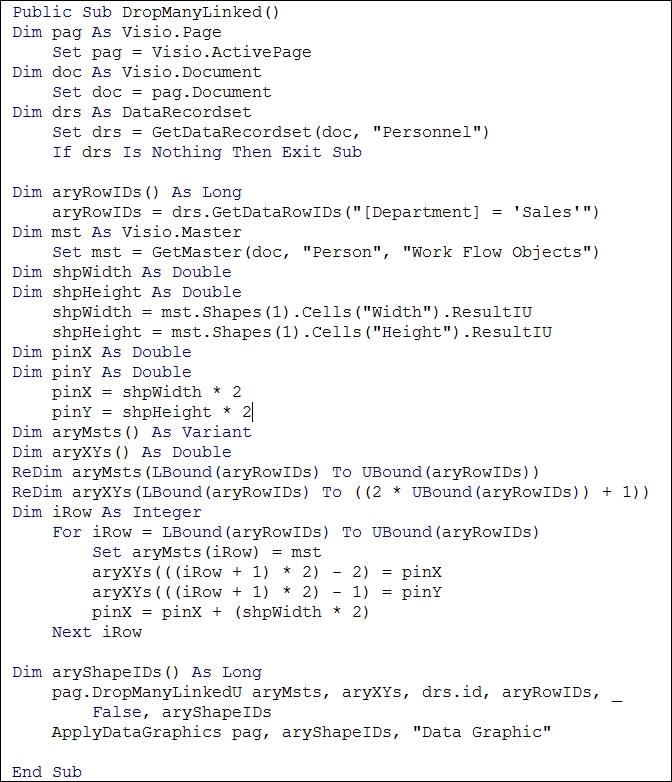
This chapter includes copious VBA macros, which contain the principles for actions in any other coding language.
In this chapter, we will learn the following:
Using a specific Master shape
Dropping and linking shapes to data
Connecting shapes from data
Adding data-linked shapes to containers
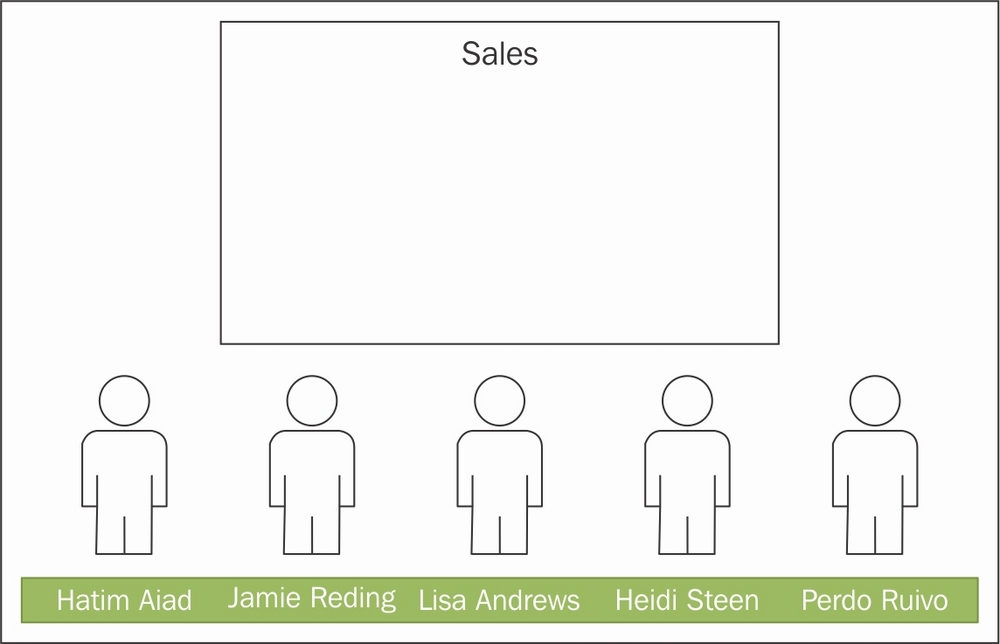
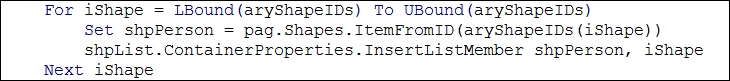
Adding data-linked shapes to lists
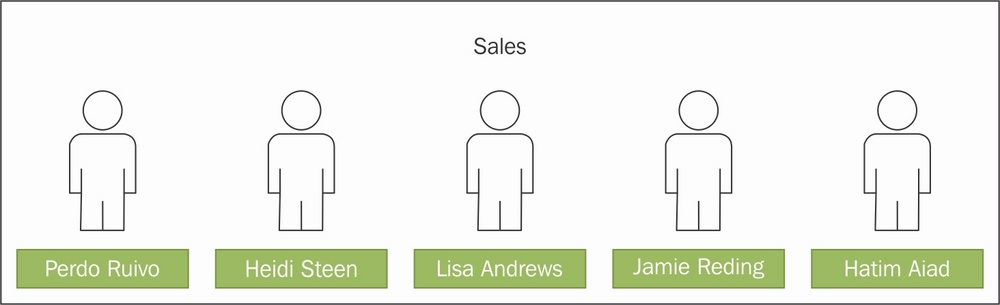
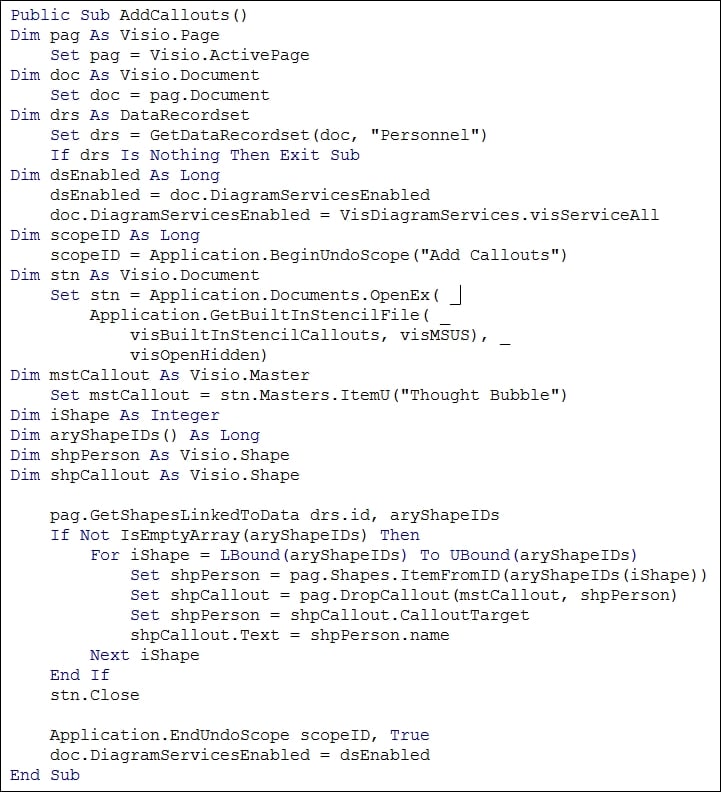
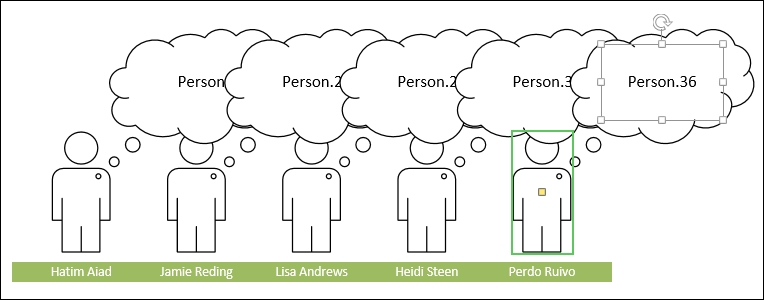
Adding callouts to shapes