Chapter 10. Graphical Report Design with iReport
So far, we have been creating all our reports by writing JRXML templates by hand. JasperSoft, the company behind JasperReports, offers a graphical report designer called iReport. iReport allows us to design reports graphically by dragging report elements into a report template and by using its graphical user interface to set report attributes.
iReport started as an independent project by Giulio Toffoli. JasperSoft recognized the popularity of iReport and, in October 2005, hired Giulio Toffoli and made iReport the official report designer for JasperSoft. Like JasperReports, iReport is also open source. It is licensed under the GNU Public License (GPL).
In 2008, iReport was rewritten to take advantage of the NetBeans platform. It is freely available both as a standalone product and as a plugin to the NetBeans IDE.
Note
In this chapter, we will be covering the standalone version of iReport; however, the material is also applicable to the iReport...
iReport can be downloaded from its home page at http://jasperforge.org/projects/ireport by clicking on the Download iReport image slightly above the center of the page.
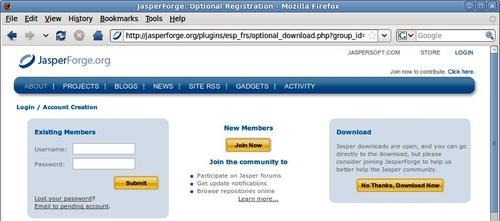
Once we click on the image, we are directed to an intermediate page where we can either log in with our JasperForge account or go straight to the download page.
Either logging in or clicking on the No Thanks, Download Now button takes us to the iReport download page.
The standalone iReport product is in the first row of the table on the page. To download it, we simply click on the Download link in the last column. Other downloads on the page are for older versions of JasperReports, iReport NetBeans plugin, and other JasperSoft products.
iReport can be downloaded as a DMG file for Macintosh computers, as a Windows installer for Windows PCs, as a source file, as a ZIP file, or as a gzipped TAR file. To install iReport, simply follow the usual application installation method for your platform.
If you chose to download...
iReport can help us quickly generate database reports. To do so, we need to provide it with the JDBC driver and connection information for our database.
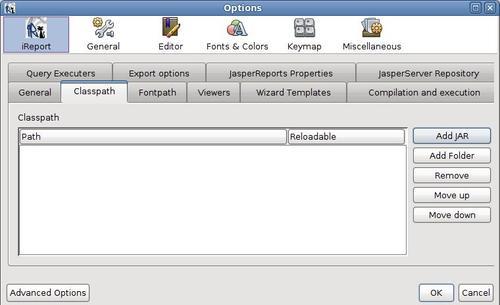
iReport comes bundled with JDBC drivers for several open source relational database systems, such as MySQL, PostgreSQL, HSQLDB, and others. If we want to connect to a different database, we need to add the JDBC driver to iReport's CLASSPATH. This can be done by clicking on Tools | Options and then selecting the Classpath tab.
To add the JDBC driver to the CLASSPATH, click on the Add JAR button, and then navigate to the location of the JAR file containing the JDBC driver. Select the JAR file and click on the OK button at the bottom of the window.
Note
We won't actually add a JDBC driver, as we are using MySQL for our examples, which is one of the RDBMS systems supported out of the box by iReport. The information just provided is for the benefit of readers using an RDBMS system that is not supported out of the box.
Before we...
Creating a database report in record time
iReport contains a wizard that allows us to quickly generate database reports (very useful if the boss asks for a report 15 minutes before the quitting time on a Friday!). The wizard allows us to use one of the predefined templates that are included with iReport. The included report templates are divided into two groups: templates laid out in a "columnar" manner and templates laid out in a "tabular" manner. Columnar templates generate reports that are laid out in columns, and tabular templates generate reports that are laid out like a table.
In this section, we will create a report displaying all the aircraft with a horsepower of 1000 or more.
To quickly create a database report, we need to go to File | New | Report Wizard.
We should then enter an appropriate name and location for our report and click on Next>.
Next, we need to select the datasource or database connection to use for our report. For our example, we will use the JDBC connection we configured...
Creating a report from scratch
In the previous section, we discussed how to quickly generate a database report by using iReport's Report Wizard. The wizard is very convenient because it allows us to create a report very quickly. However, its disadvantage is that it is not very flexible. In this section, we will learn how to create a report from scratch in iReport. Our report will show the tail number, serial number, and model of every aircraft in the FlightStats database.
To create a new report, we need to go to the File | New | Empty report menu item.
At this point, we should enter a Report name and Location.
In this example, we will set the report name to iReportDemo and accept all the other default values. After clicking on the OK button, iReport's main window should look like this:
The horizontal lines divide the different report sections. Any item we insert between any two horizontal lines will be placed in the appropriate report section's band. Horizontal lines can be dragged to resize...
Creating more elaborate reports
In the previous section, we created a fairly simple database report. In this section, we will modify that report to illustrate how to add images, charts, and multiple columns to a report. We will also see how to group report data. We will perform all of these tasks graphically with iReport.
Adding images to a report
Adding static images to a report is very simple with iReport. Just drag the Image component from the Palette to the band where it will be rendered in the report.
When we drop the image component into the appropriate band, a window pops up asking us to specify the location of the image file to display.
After we select the image, we can drag it to its exact location where it will be rendered.
As we can see, adding images to a report using iReport couldn't be any simpler.
Adding multiple columns to a report
The report we've been creating so far in this chapter contains over 11,000 records. It spans over 300 pages. As we can see, there is a lot of space between...
Although this chapter didn't discuss every iReport feature, I'm confident that iReport is intuitive enough after you get comfortable with it. Some of the iReport features not covered in this chapter include subreport creation and adding crosstabs, lines, ellipses, and rectangles to a report. However, we have learned all these features the "hard" way by creating a JRXML template by hand. For someone familiar with JasperReports, adding these features to a report created by iReport should be trivial. If more help is needed, JasperSoft provides additional documentation for iReport, and lots of knowledgeable people frequent the iReport forums at http://jasperforge.org/plugins/espforum/browse.php?group_id=83&forumid=101.
This chapter taught us how to install and set up iReport, use iReport's Report Wizard to quickly generate a report, and graphically design custom reports. Moreover, we learned how to group report data graphically with iReport, to add multiple columns to a report, and to add images and charts to a report graphically with iReport.
iReport is a very powerful tool that can significantly reduce report design time. To use all of the features of iReport effectively, however, an iReport user must be familiar with basic JasperReports concepts, such as bands, report variables, report fields, and so on.