


PLOT BAR CHARTS
Listing 5.21 displays the contents of barchart1.py that illustrates how to plot a bar chart in Matplotlib.
Listing 5.21: barchart1.py
import matplotlib.pyplot as plt

x = [3, 1, 3, 12, 2, 4, 4]
y = [3, 2, 1, 4, 5, 6, 7]

plt.bar(x, y)

plt.title("Bar Chart")
plt.legend(["bar"])
plt.show()
Listing 5.21 contains an import statement followed by the variables x and y that are initialized as a list of numbers. Next, the bar chart is generated by invoking the bar() method of the plt class. The final block of code sets the title and legend for the bar chart and then displays the bar chart. Launch the code in Listing 5.21 and you will see the pie chart displayed in Figure 5.13.
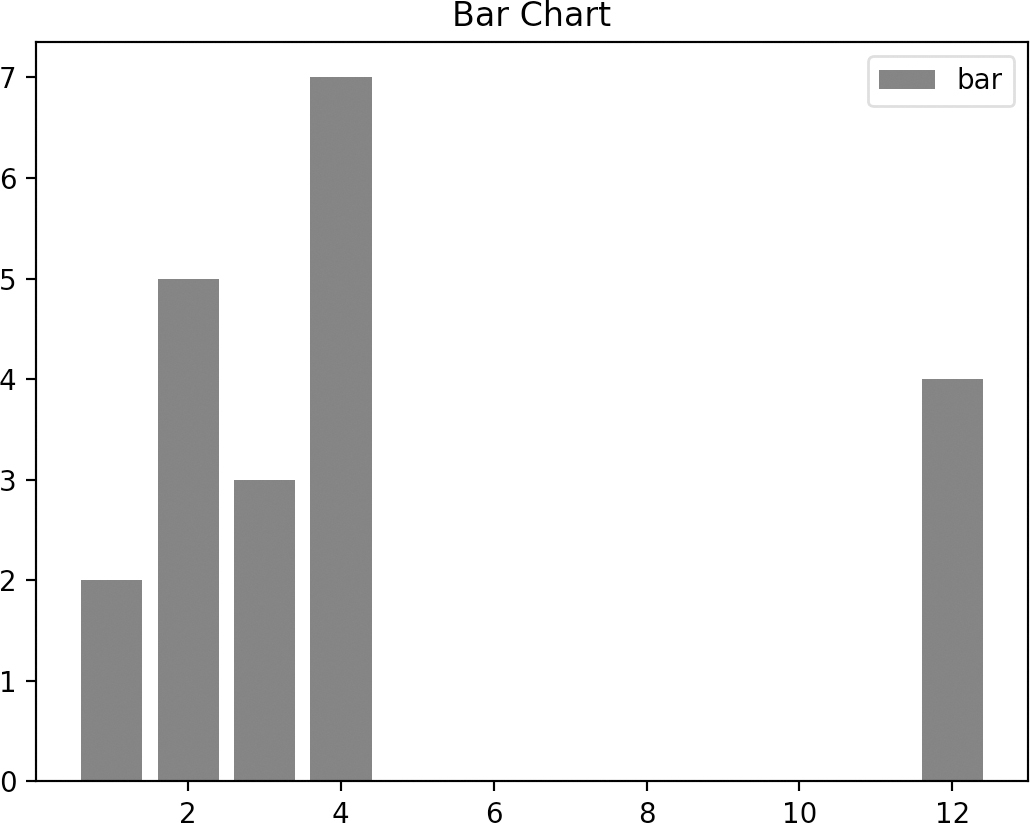
FIGURE 5.13 A bar chart from array data.
Listing 5.22 displays the contents of barchart2.py that illustrates how to plot a bar chart in Matplotlib.
Listing 5.22: barchart2.py
import matplotlib.pyplot as plt

plt.bar([0.25,1.25,2.25,3.25,4.25],
        [50,40,70,80,20],
        label...


