


A HISTOGRAM IN MATPLOTLIB
Listing 5.17 displays the content of histogram1.py that illustrates how to plot a histogram using Matplotlib.
LISTING 5.17: histogram1.py
import matplotlib.pyplot as plt

x = [1, 2, 3, 4, 5, 6, 7, 4]

plt.hist(x, bins = [1, 2, 3, 4, 5, 6, 7])
plt.title("Histogram")
plt.legend(["bar"])
plt.show()
Listing 5.17 is straightforward: the variable x is initialized as a set of numbers, followed by a block of code that renders a histogram based on the data in the variable x. Launch the code in Listing 5.17, and you will see the histogram that is shown in Figure 5.14.
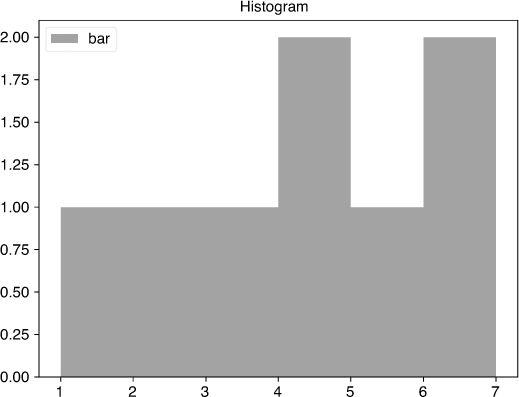
FIGURE 5.14 A histogram based on random values


