


A GRID OF POINTS IN MATPLOTLIB
Listing 5.8 displays the content of plotgrid.py that illustrates how to plot a simple grid.
LISTING 5.8: multi_lines.py
import matplotlib.pyplot as plt

x_coord = [ 50, 300, 175, 50]
y_coord = [ 50, 50,  150, 50]
plt.plot(x_coord,y_coord)
plt.scatter(x_coord,y_coord)

for x,y in zip(x_coord,y_coord):
  plt.text(x,y,'Coord ({x},{y})'.format(x=x,y=y))

x_coord = [ 175, 300,  50, 175]
y_coord = [  50, 150, 150, 50]
plt.plot(x_coord,y_coord)
plt.scatter(x_coord,y_coord)

for x,y in zip(x_coord,y_coord):
  plt.text(x,y,'Coord ({x},{y})'.format(x=x,y=y))
plt.show()
Listing 5.8 defines the NumPy variable points that defines a 2D list of points with three rows and four columns. The Pyplot API plot() uses the points variable to display a grid-like pattern. Figure 5.5 displays a grid of points, as defined in Listing 5.8.
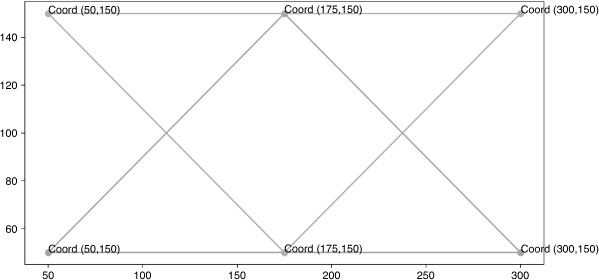
FIGURE 5.5 A grid of points generated by the code in Listing 5.8


