Search icon CANCEL
Subscription
0
Cart icon
Your Cart (0 item)
Close icon
You have no products in your basket yet
Arrow left icon
Explore Products
Best Sellers
New Releases
Books
Events
Videos
Audiobooks
Packt Hub
Free Learning
Arrow right icon
timer SALE ENDS IN
0 Days
:
00 Hours
:
00 Minutes
:
00 Seconds
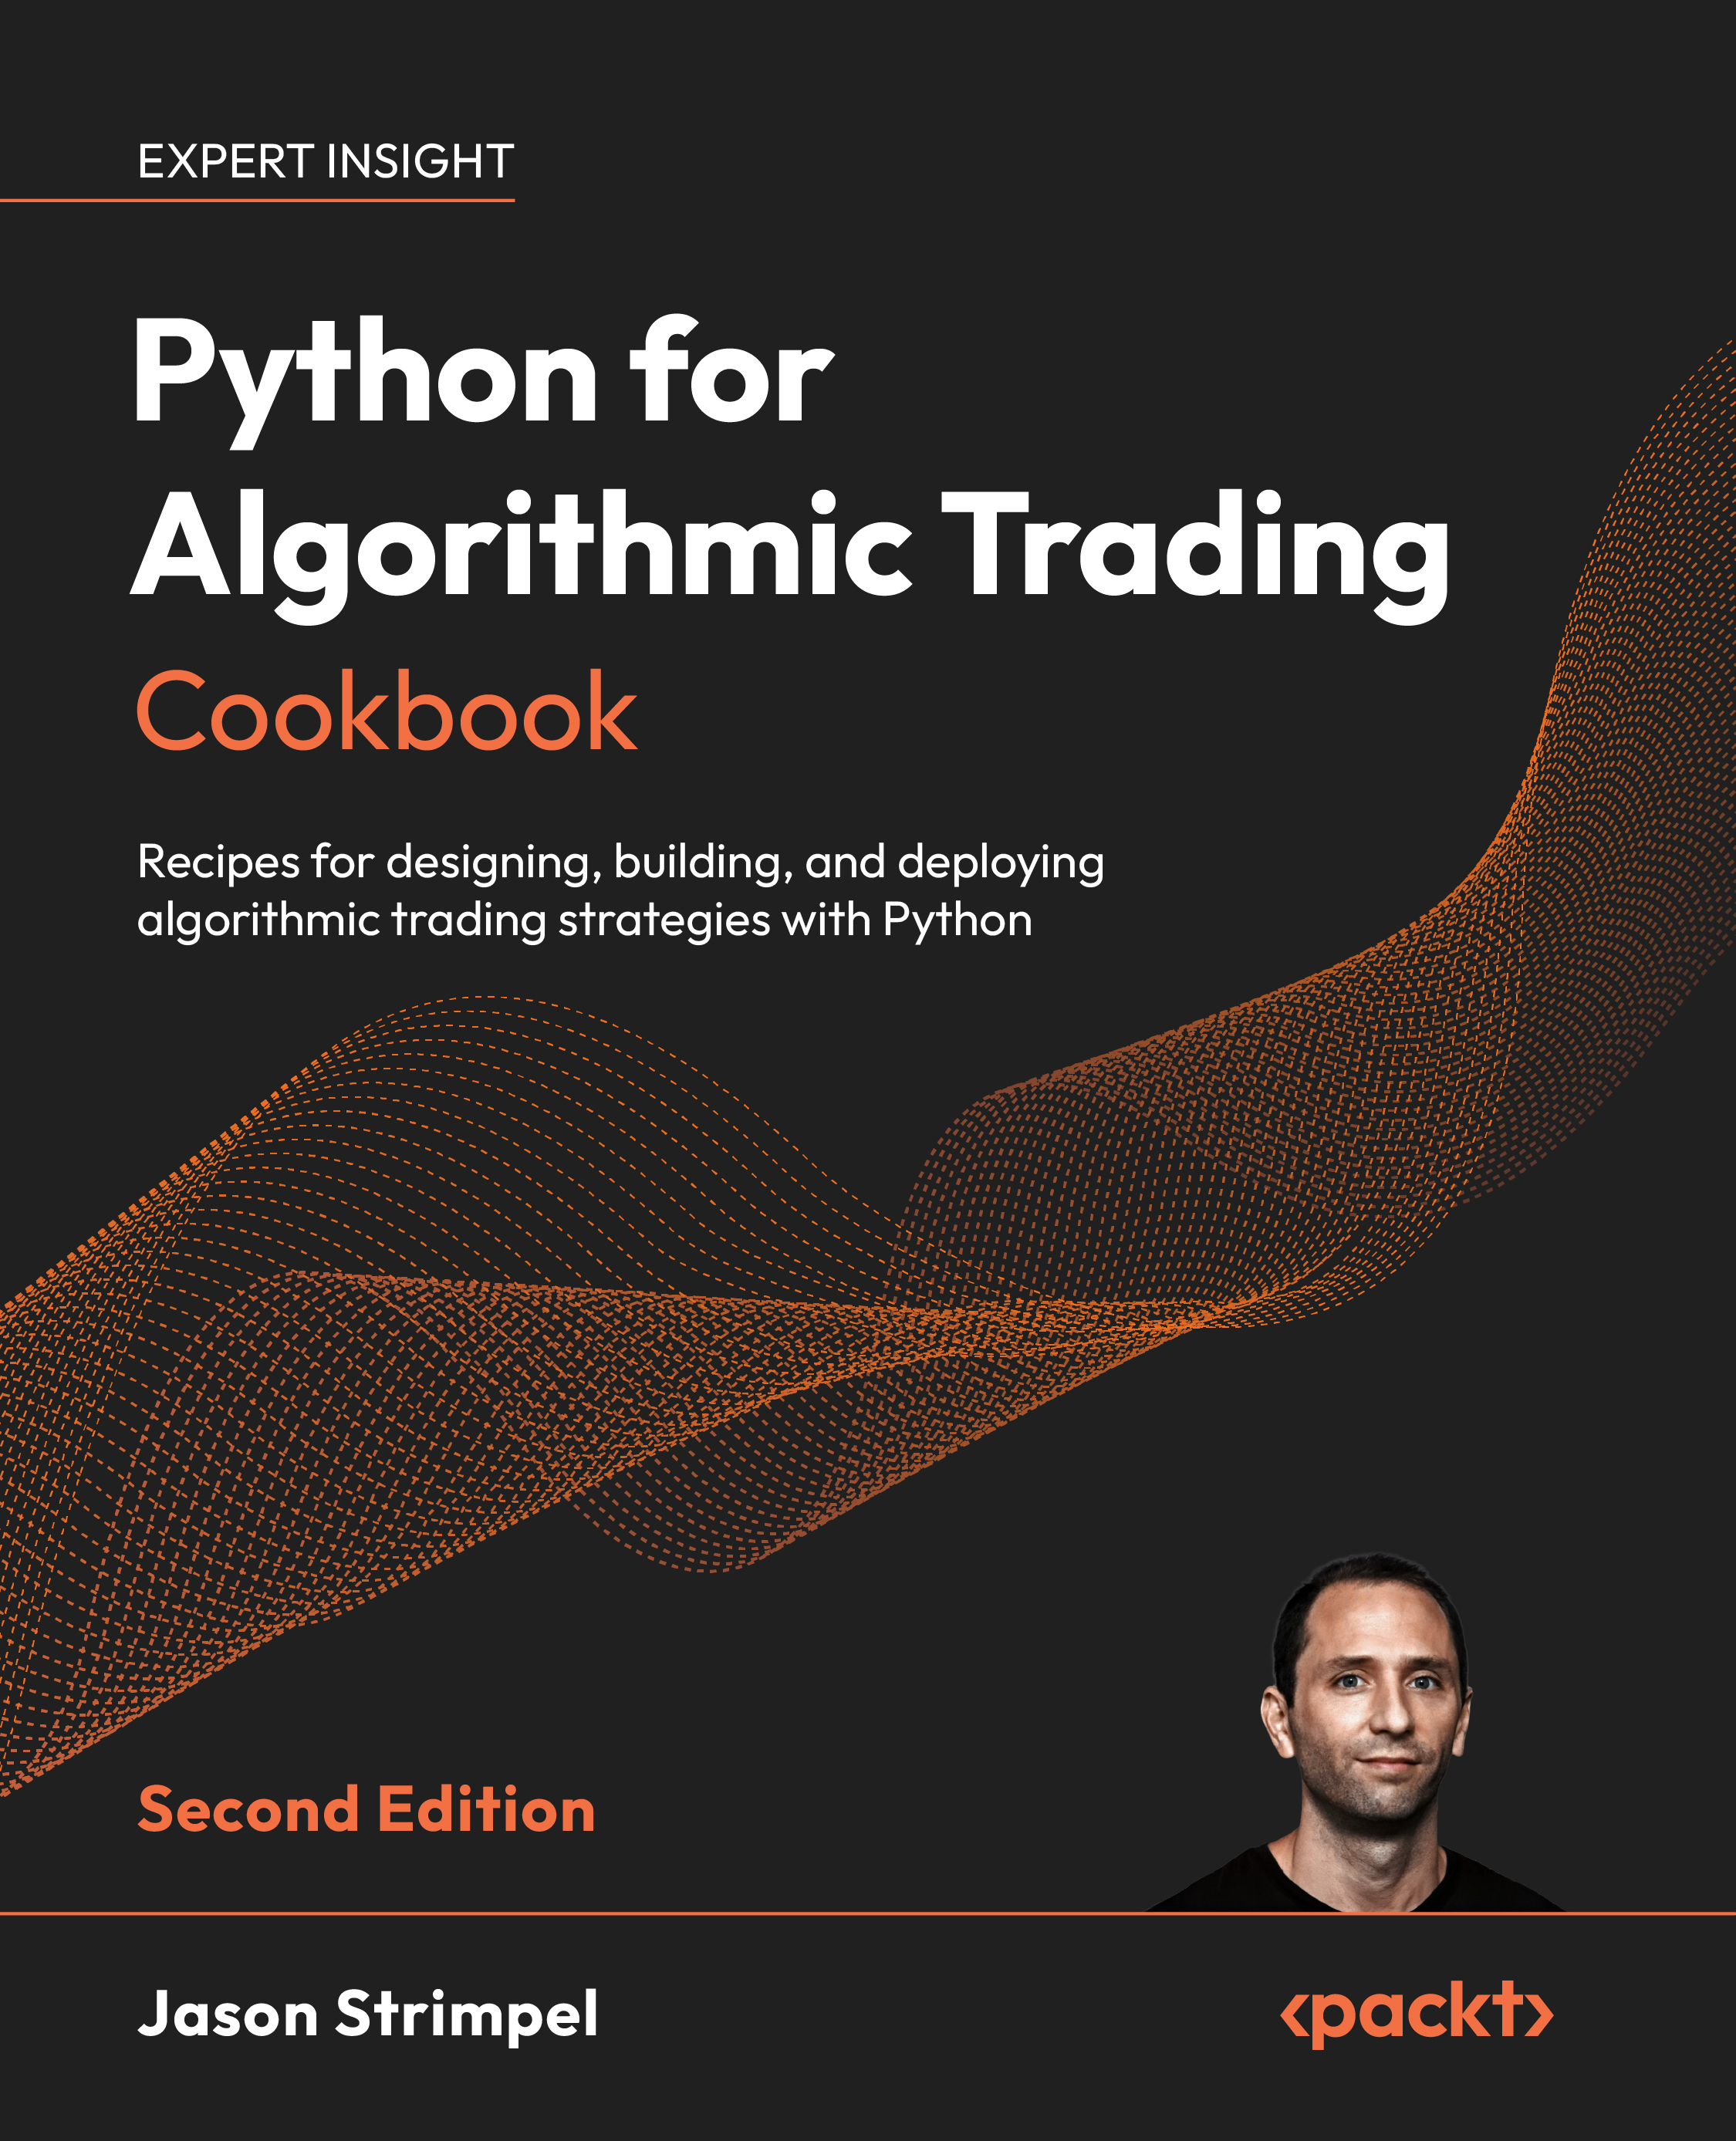
Python for Algorithmic Trading Cookbook

Python for Algorithmic Trading Cookbook: Recipes for designing, building, and deploying algorithmic trading strategies with Python , Second Edition

Arrow left icon
Profile Icon Jason Strimpel
Arrow right icon
$59.99
Paperback Jul 2026 536 pages 2nd Edition
eBook
$35.99 $47.99
Paperback
$59.99
Arrow left icon
Profile Icon Jason Strimpel
Arrow right icon
$59.99
Paperback Jul 2026 536 pages 2nd Edition
eBook
$35.99 $47.99
Paperback
$59.99
eBook
$35.99 $47.99
Paperback
$59.99

What do you get with Print?

Product feature icon Instant access to your digital copy whilst your Print order is Shipped
Product feature icon Colour book shipped to your preferred address
Product feature icon Redeem a companion digital copy on all Print orders
Product feature icon Access this title in our online reader with advanced features
Product feature icon DRM FREE - Read whenever, wherever and however you want
Product feature icon AI Assistant (beta) to help accelerate your learning
Modal Close icon
Payment Processing...
tick Completed

Shipping Address

Billing Address

Shipping Methods
Table of content icon View table of contents Preview book icon Preview Book

Python for Algorithmic Trading Cookbook

1

Acquire Free Financial Market Data with Cutting-Edge Python Libraries

A May 2017 Economist cover declared data to be the world's most valuable resource. It's no truer than in algorithmic trading. As algorithmic traders, it's our job to acquire and make sense of billions of rows of market data for use in trading algorithms. In this context, it's crucial to gather high-quality, reliable data that can adequately support trading algorithms and market research. Luckily for us, it's possible to acquire high-quality data for free (or nearly free).

This chapter offers recipes for a series of different Python libraries—including the cutting-edge OpenBB Open Data Platform (OpenBB Platform for short)—to acquire free financial market data using Python. One of the primary challenges most non-professional traders face is getting all the data required for analysis together in one place. The OpenBB Platform addresses this issue. We'll dive into acquiring data for a variety of assets, including stocks, options, futures (both continuous and individual contracts), and Fama-French factors.

One crucial point to remember is that data can vary across different sources. For instance, prices from two sources might differ due to distinct data sourcing methods or different adjustment methods for corporate actions. Some of the libraries we'll cover might download data for the same asset from the same source. However, libraries vary in how they return that data based on options that help you preprocess the data in preparation for research.

Lastly, while we'll focus heavily on mainstream financial data in this chapter, financial data is not limited to prices. The concept of "alternative data," which includes non-traditional data sources such as satellite images, web traffic data, or customer reviews, can be an important source of information for developing trading strategies. The Python tools to acquire and process this type of data are outside the scope of this book. We've intentionally left out the methods of acquiring and processing this type of data since it's covered in other resources dedicated to the topic.

In this chapter, we'll cover the following recipes:

  • Working with stock market data with the OpenBB Platform
  • Fetching historical futures data with the OpenBB Platform
  • Navigating options market data with the OpenBB Platform
  • Harnessing factor data using pandas_datareader

Technical requirements

This book relies on the Anaconda distribution of Python. We'll use Jupyter Notebook and Python script files to write the code. Unless specified otherwise, all the code should be written in Jupyter Notebooks.

Download and install the Anaconda distribution of Python. You can do this by going to https://www.anaconda.com/download. Depending on your operating system, the instructions for downloading and installing will vary. Please refer to the Anaconda documentation for detailed instructions.

Anaconda ships with a package manager called conda. Package managers make it easy to install, remove, and update Python packages. There's a great cheat sheet for the conda package manager available at https://docs.conda.io/projects/conda/en/4.6.0/_downloads/52a95608c49671267e40c689e0bc00ca/conda-cheatsheet.pdf.

Once you've installed the Anaconda distribution, open your Terminal on Mac or Linux or the Anaconda Prompt on Windows. If you're a Windows user, make sure to use the Command Prompt instead of the PowerShell prompt. Then follow these steps:

  1. Update the conda package manager and follow any instructions to accept license agreements:
    conda update -n base conda -y
  2. Create a virtual environment:
    conda create -n my-quant-stack python=3.11 -y
  3. After the installation process is complete, activate the environment:
    conda activate my-quant-stack
  4. Install Jupyter Notebook using the package manager that ships with Python, pip:
    pip install notebook matplotlib

This will set up a virtual environment using Python 3.11 and install Jupyter Notebook.

This chapter will use two Python libraries to acquire financial market data: the OpenBB Platform and pandas_datareader. The good news is that installing the OpenBB Platform installs many of the libraries you will need to acquire financial market data, including pandas_datareader. As such, there is no need to install the libraries separately.

Install the OpenBB Platform with all extensions and providers (both officially supported and community-maintained ones) using pip:

pip install openbb[all]

This is the easiest way to set up the OpenBB Platform for this book.

Important

In a macOS zsh Terminal shell, add quotation marks around the library name: "openbb[all]".

To install a single extension:

pip install openbb[charting]
pip install openbb[ta]

Or install a single provider:

pip install openbb[yfinance]

To install the Nightly distribution (this installs all extras by default):

pip install openbb-nightly


Important

At the time of writing, installing the OpenBB Platform using pip isn't compatible with environments such as Google Colab and Kaggle since they come with preinstalled packages that can conflict with the ones used by the OpenBB Platform. If you run into trouble installing the OpenBB Platform, please check the online documentation for the most up-to-date instructions.

This book makes extensive use of Jupyter Notebooks. You can review instructions for using Jupyter Notebook here: https://docs.jupyter.org/en/latest/

Your purchase includes a free PDF copy + exclusive extras

Your purchase includes a DRM-free PDF copy of this book, 7-day trial to the Packt+ library (no credit card required), and additional exclusive extras. See the Free benefits with your book section in the Preface to unlock them instantly and maximize your learning.

Working with stock market data on the OpenBB platform

You may remember the meme stock hysteria that sent GameStop's stock up 1,744% in January 2021. One of the good things that came from that episode was the GameStonk terminal, now rebranded as OpenBB. OpenBB is one of the most popular open-source finance projects on GitHub for good reason: it provides a single interface to access hundreds of data feeds from one place in a standard way. OpenBB has a command-line interface that is great for manual investment research. But when it's time to get data into Python, you want the OpenBB Platform. This recipe will guide you through the process of using the OpenBB Platform to fetch stock market data.

Getting ready

By now, you should have the OpenBB Platform installed in your virtual environment. If not, go back to the beginning of this chapter and get it set up. The OpenBB Platform is free to use and offers a web-based UI to manage your configuration files, store API keys, and get code walkthroughs and examples. Sign up for a free Hub account at https://my.openbb.co/login. The popular course, Getting Started with Python for Quant Finance, uses the OpenBB Platform exclusively for all the code. Check out https://www.pyquantnews.com/getting-started-with-python-for-quant-finance for information on how to join.

How to do it…

Using the OpenBB Platform involves one import:

  1. Import the OpenBB Platform:
    from openbb import obb
    obb.user.preferences.output_type = "dataframe"
  2. Use the historical method to download price data for the SPY ETF:
    data = obb.equity.price.historical("SPY", provider="yfinance")
  3. Inspect the resulting DataFrame:
    print(data)
  4. Running the preceding code generates a pandas DataFrame and prints the data to the screen:
    Figure 1.1: Historic price data for SPY

    Figure 1.1: Historic price data for SPY

How it works…

The OpenBB Platform follows an easy-to-understand namespace convention. All the methods for acquiring stock price data are methods on openbb.equity.

The historical method accepts a ticker symbol and returns the open, high, low, close, adjusted close, volume, and dividend in a pandas DataFrame. The additional parameters you can specify are as follows:

  • start_date: Start date to get data from with
  • interval: Interval (in minutes) to get data—that is, 1, 5, 15, 30, 60, or 1,440
  • end_date: End date to get data from with
  • provider: Source of data extracted

There's more…

An important benefit of using the OpenBB Platform is choosing your data source. By default, the OpenBB Platform will attempt to download data from free sources such as Yahoo! Finance. In most OpenBB Platform calls, you can indicate a different source. To use a source that requires an API key (either free or paid), you can configure it in the OpenBB Hub.

Check out the OpenBB Platform documentation for the latest functionality: https://docs.openbb.co/python.

Let's look at some more of the functions of the OpenBB Platform.

Comparison of fundamental data

Not only can the OpenBB Platform download fundamental data in an organized and usable way, but it can also concatenate it in a single Pandas DataFrame for further analysis.

We can use the following code to see the balance sheet metrics from AAPL and MSFT:

obb.equity.fundamental.metrics(
    "AAPL,MSFT",
    provider="yfinance"
)

The output of the preceding snippet is a pandas DataFrame with fundamental data for each ticker that was passed:

Figure 1.2: Balance sheet data for MSFT and AAPL

Figure 1.2: Balance sheet data for MSFT and AAPL

Building stock screeners

One of the most powerful features of the OpenBB Platform is the custom stock screener. A stock screener allows you to use filters to identify stocks that might be interesting to trade. It uses the Finviz stock screener under the hood and surfaces metrics across a range of stocks based on either pre-built or custom criteria. See the documentation for more on how to use the OpenBB screener functions (https://docs.openbb.co/python/reference/equity/screener):

  1. Create an overview screener based on a list of stocks using the default view:
    obb.equity.compare.groups(
        group="industry",
        metric="valuation",
        provider="finviz"
    )

    The output of the preceding snippet is the following pandas DataFrame:

    Figure 1.3: Results of a comparison screener between F, GE, and TSLA

    Figure 1.3: Results of a comparison screener between F, GE, and TSLA

  2. Create a screener that returns the top gainers from the technology sector based on a preset:
    obb.equity.compare.groups(
        group="technology",
        metric="performance",
        provider="finviz"
    )

    The output of the preceding snippet is the following pandas DataFrame:

    Figure 1.4: Results of a screener showing the day's top-gaining stocks

    Figure 1.4: Results of a screener showing the day's top-gaining stocks

  3. Create a screener that presents an overview grouped by sector:
    obb.equity.compare.groups(
        group="sector",
        metric="overview",
        provider="finviz"
    )

    The output of the preceding snippet is the following pandas DataFrame:

    Figure 1.5: Results of a screener grouped by sector

    Figure 1.5: Results of a screener grouped by sector

See also

For more on OpenBB and the Finviz stock screener, check out the following resources:

Fetching historical futures data with the OpenBB platform

Traders use continuous futures data for backtesting trading strategies. Futures traders use the roll from one contract to another as a potential opportunity for profit. The roll is the process of exiting a position in a contract as it expires and entering a position into a contract that expires in the future. Some traders simply pick an expiration date to roll to the next contract, while others use sophisticated techniques involving open interest. This basis trade is persistently one of the most popular trading strategies for futures traders. These traders want control over the data that's used to compute the basis trade, so acquiring individual contract data is important. This recipe will guide you through the process of using the OpenBB Platform to fetch individual futures contract data.

Getting ready

By now, you should have the OpenBB Platform installed in your virtual environment. If not, go back to the beginning of this chapter and get it set up.

How to do it…

We'll use the futures functionality in the OpenBB Platform to download individual futures data for free:

  1. Import pandas and the OpenBB Platform:
    import pandas as pd
    from openbb import obb
    obb.user.preferences.output_type = "dataframe"
  2. Download the current futures curve for the VIX futures contract from the Chicago Board Options Exchange (CBOE):
    data = obb.derivatives.futures.curve(symbol="VX_EOD")
  3. Inspect the resulting DataFrame:
    print(data)
  4. Running the preceding code generates the futures curve for the VIX futures contract:
    Figure 1.6: Settlement prices for the forward VIX index futures contracts

    Figure 1.6: Settlement prices for the forward VIX index futures contracts

  5. Update the DataFrame index to the expiration dates and plot the settlement prices:
    data.index = pd.to_datetime(data.expiration)
    data.plot()
  6. By running the preceding code, we plot the VIX futures curve:
    Figure 1.7: VIX futures curve

    Figure 1.7: VIX futures curve

There's more…

You can use the obb.derivatives.futures.historical method to get historical data for an individual expiration. Stitching together data across a range of years can provide insight into the market's expectation of supply and demand of the underlying commodity:

  1. First, create a list containing the year and month expirations you're interested in:
    expirations = [
        "2026-12",
        "2027-12",
        "2028-12",
        "2029-12",
        "2030-12",
    ]

    The preceding code creates a Python list of expiration years and dates in string format.

  2. Now, loop through each of the expirations to download the data:
    contracts = []
    for expiration in expirations:
        df = (
            obb
            .derivatives.futures.historical(
                symbol="CL",
                expiration=expiration,
                start_date="2020-01-01",
                end_date="2022-12-31",
                provider="yfinance"
            )
        ).rename(columns={
            "close": expiration
        })
        contracts.append(df[expiration])
  3. For each of the contracts, use the OpenBB Platform to download historical futures data for the CL contract between January 1, 2020, and December 31, 2022. Using the pandas rename method, change the column name from "close" to the expiration date. Finally, append the newly created pandas DataFrame to a list of DataFrames:
    historical = (
        pd
        .DataFrame(contracts)
        .transpose()
        .dropna()
    )
  4. Concatenate the DataFrames together, swap the columns and rows using the transpose method, and drop any with no data using the dropna method. Inspect the resulting DataFrame:
    print(historical)
  5. By printing the DataFrame, we will see the historical settlement prices:
    Figure 1.8: Historic settlement prices for the December CL futures contract

    Figure 1.8: Historic settlement prices for the December CL futures contract

    The result is the data between January 2020 and December 2022 for each of the December expirations between 2023 and 2030.

    To visualize the market's expectation of the future supply and demand of the December contract, you can plot the last price:

    historical.iloc[-1].plot()

    Here's the output:

    Figure 1.9: Futures curve for the December CL contract

    Figure 1.9: Futures curve for the December CL contract

See also

For more on the Platform futures functionality, you can browse the following documentation:

Navigating options market data with the OpenBB platform

Options are exchange-listed derivative contracts that convey the right (but not the obligation) to buy or sell the underlying stock at a certain price on or before a certain expiration date. Options are among the most versatile financial instruments in the market. They allow traders to define their risk profiles before entering trades and express market views not only on the direction of the underlying but also the volatility. While options offer a high degree of flexibility for trading, this feature complicates data collection for research and backtesting.

A single underlying stock can have an array of options contracts with different combinations of strike prices and expiration dates. Collecting and manipulating this data is a challenge. The combination of options contracts for all strikes and expiration dates is commonly referred to as an options chain. There can be thousands of individual options contracts at a given time for a single underlying stock. Not only does the number of individual contracts pose a challenge, but getting price data has historically been expensive. With the introduction of the OpenBB Platform, it is now only a few lines of Python code to download options chains into a pandas DataFrame. This recipe will walk you through acquiring options data using the OpenBB Platform.

Getting ready

By now, you should have the OpenBB Platform installed in your virtual environment. If not, go back to the beginning of this chapter and get it set up.

How to do it…

Similar to how we used the OpenBB Platform for futures data, we can use it for options data too:

  1. Import the OpenBB Platform and Matplotlib for visualization:
    from openbb import obb
    obb.user.preferences.output_type = "dataframe"
  2. Use the chains method to download the entire options chain:
    chains = obb.derivatives.options.chains(symbol="SPY")
  3. Inspect the resulting DataFrame:
    chains.info()
  4. By running the preceding code, we'll see the details of the options chain data:
    Figure 1.10: Preview of the data downloaded for the SPY options chains

    Figure 1.10: Preview of the data downloaded for the SPY options chains

Note that at the time of writing, there are 10,364 options contracts for the SPY Exchange Traded Fund (ETF) that can be downloaded from CBOE (for free).

How it works…

The obb.derivatives.options.chains method downloads the entire options chain and stores it in a pandas DataFrame. The obb.derivatives.options.chains has an additional optional parameter:

  • provider: The source from which the data should be downloaded. The default is CBOE. You can also select Tradier, Intrinio, or TMX. Note that for Tradier, Intrinio, and TMX, you need to provide your API key, which can be configured in the OpenBB Hub.

There's more…

You can use the OpenBB Platform to download historical options data for a single contract. To do this, you need the option symbol.

We'll use the obb.equity.price.historical method to get the historical options data for an SPY call option with a strike price of $675 expiring on December 18, 2026:

data = obb.equity.price.historical(
    symbol="SPY261218C00675000",
    provider="yfinance"
)[["close", "volume"]]

Hint

The option contract may have expired by the time you run this code. If you get an error from OpenBB saying the contract cannot be found, you'll need to select an option contract that is actively trading.

The result is a pandas DataFrame with the closing price and volume of the options contract:

Figure 1.11: Closing prices and volume of the SPY options contract

Figure 1.11: Closing prices and volume of the SPY options contract

Option Greeks

Options Greeks measures how options prices change given a change in one of the inputs to an options pricing model. For example, delta measures how an option's price changes given a change in the underlying stock price.

Using obb.derivatives.options.chains, the OpenBB Platform returns the most used Greeks, including Delta, Gamma, Theta, Vega, and Rho.

See also

Options are a fascinating and deep topic that is rich with opportunities for trading. You can learn more about options, volatility, and how to analyze both via the OpenBB Platform:

Harnessing factor data using pandas_datareader

Diversification is great until the entire market declines in value. That's because the overall market influences all assets. Factors can offset some of these risks by targeting drivers of return not influenced by the market. Common factors are size (large-cap versus small-cap) and style (value versus growth). If you think small-cap stocks will outperform large-cap stocks, then you might want exposure to small-cap stocks. If you think value stocks will outperform growth stocks, then you might want exposure to value stocks. In either case, you want to measure the risk contribution of the factor. Eugene Fama and Kenneth French built the Fama-French three-factor model in 1992. The three Fama-French factors are constructed using six value-weighted portfolios formed on capitalization and book-to-market.

The three factors are as follows:

  • Small Minus Big, which represents the differential between the average returns of three small-cap portfolios and three large-cap portfolios
  • High Minus Low, which quantifies the difference in average returns between two value-oriented portfolios and two growth-oriented portfolios
  • Rm-Rf, which denotes the market's excess return over the risk-free rate

We'll explore how to measure and isolate alpha in Chapter 7, Build Alpha Factors for Stock Portfolios. This recipe will guide you through the process of using pandas_datareader to fetch historical factor data for use in your analysis.

Getting ready

You can install pandas_datareader with pip either in a terminal with this command:

pip install pandas_datareader

Or directly in a Jupyter Notebook cell:

!pip install pandas_datareader

You'll need pandas_datareader to follow along with this recipe.

Note that you'll need pandas version 2 to use pandas_datareader. You can install it with the following command:

pip install --upgrade "pandas<3" "pandas-datareader==0.10.0"

How to do it…

Using the pandas_datareader library, we have access to dozens of investment research factors:

  1. Import pandas_datareader:
    import pandas_datareader as pdr
  2. Download the monthly factor data starting in January 2000:
    factors = pdr.get_data_famafrench("F-F_Research_Data_Factors")
  3. Get a description of the research data factors:
    print(factors["DESCR"])
  4. The result is an explanation of the data included in the DataFrame:
    Figure 1.12: Preview of the description that is downloaded with factor data

    Figure 1.12: Preview of the description that is downloaded with factor data

  5. Inspect the monthly factor data:
    print(factors[0].head())
  6. By running the preceding code, we get a DataFrame containing monthly factor data:
    Figure 1.13: Preview of the monthly data downloaded from the Fama-French Data Library

    Figure 1.13: Preview of the monthly data downloaded from the Fama-French Data Library

  7. Inspect the annual factor data:
    print(factors[1].head())
  8. By running the preceding code, we get a DataFrame containing annual factor data:
    Figure 1.14: Preview of the annual data downloaded from the Fama-French Data Library

    Figure 1.14: Preview of the annual data downloaded from the Fama-French Data Library

How it works…

Under the hood, pandas_datareader fetches data from the Fama-French Data Library by downloading a compressed CSV file, uncompressing it, and creating a pandas DataFrame.

There are 297 different datasets with different factor data available from the Fama-French Data Library. Here are some popular versions of the Fama-French 3-factor model for different regions:

  • Developed_3_Factors
  • Developed_ex_US_3_Factors
  • Europe_3_Factors
  • Japan_3_Factors
  • Asia_Pacific_ex_Japan_3_Factors

You can use these in the get_data_famafrench method just like F‑F_Research_Data_Factors.

Some datasets return a dictionary with more than one DataFrame representing data for different time frames, portfolio weighting methodologies, and aggregate statistics. Data for these portfolios can be accessed using numerical keys. For example, the 5_Industry_Portfolios dataset returns eight DataFrames in the dictionary. The first can be accessed using the 0 dictionary key, the second using the 1 dictionary key, and so on. Each dictionary includes a description of the dataset, which can be accessed using the DESCR dictionary key.

There's more…

pandas_datareader can be used to access data from many remote online sources. These include Tiingo, IEX, Alpha Vantage, FRED, Eurostat, and many more. Review the full list of data sources on the documentation page here:https://pandas-datareader.readthedocs.io/en/latest/remote_data.html.

See also

For more details on the factors available in the investment factor research library, take a look at the following resources. For another example of using the Fama-French 3-factor model, see the resources on the PyQuant News website:

Get this book's PDF version and more

Scan the QR code (or go to packtpub.com/unlock). Search for this book by name, confirm the edition, and then follow the steps on the page.

Image

Image

Note: Keep your invoice handy. Purchases made directly from Packt don't require an invoice.

Left arrow icon Right arrow icon
Download code icon Download Code

Key benefits

  • Backtest Python trading strategies with VectorBT and Zipline Reloaded using walk-forward analysis
  • Measure risk, performance, and alpha quality with Alphalens Reloaded and PyFolio
  • Automate strategy execution with the Interactive Brokers API for live trading

Description

Get practical Python code for algorithmic trading from Jason Strimpel, founder of PyQuant News and a veteran of global trading, risk management, and machine learning. This hands-on guide shows you how to turn market data into tested, automated trading strategies using modern Python tools. You’ll source equities, options, and futures data with OpenBB and FMP, then accelerate Python for data analysis workflows with Pandas, Polars, Parquet, DuckDB, and ArcticDB. You’ll visualize market data with Matplotlib, Seaborn, and Plotly Dash before moving into alpha research and quantitative trading techniques. Detailed recipes help you engineer alpha factors with PCA, regression, Fama-French models, SciPy, and statsmodels. You’ll design and evaluate quantitative trading strategies using VectorBT, Zipline Reloaded, Alphalens Reloaded, and PyFolio, including walk-forward analysis and risk-aware performance review. For execution, you’ll connect to the Interactive Brokers API to stream ticks, manage orders, retrieve portfolio state, and monitor live trading workflows. By the end, you’ll have reusable Python templates for researching, backtesting, evaluating, and operating algorithmic trading strategies.

Who is this book for?

This book is for traders, investors, and Python enthusiasts who need practical code to acquire, analyze, and automate algorithmic trading strategies using modern, high-performance Python tools. Readers should have some exposure to investing or trading, a basic familiarity with Python syntax, and a basic knowledge of libraries such as Pandas and NumPy. This book is ideal for discretionary traders who want to adopt a systematic approach and apply professional techniques, such as factor modeling, backtesting, and execution automation, to trading workflows using Python.

What you will learn

  • Acquire equities, futures, and options data using OpenBB and FMP
  • Process and analyze time series data efficiently with pandas and Polars
  • Store and query massive datasets with ArcticDB, DuckDB, and Parquet
  • Visualize trading data using Matplotlib, Seaborn, and Plotly Dash
  • Engineer alpha factors using PCA, regression, and Fama-French models
  • Backtest strategies with VectorBT and Zipline Reloaded frameworks
  • Evaluate performance and risk using Alphalens Reloaded and PyFolio
  • Deploy and automate live trades using the Interactive Brokers API
Estimated delivery fee Deliver to Japan

Standard delivery 10 - 13 business days

$8.95

Premium delivery 3 - 6 business days

$34.95
(Includes tracking information)

Product Details

Country selected
Publication date, Length, Edition, Language, ISBN-13
Publication date : Jul 10, 2026
Length: 536 pages
Edition : 2nd
Language : English
ISBN-13 : 9781806662036
Category :
Languages :

What do you get with Print?

Product feature icon Instant access to your digital copy whilst your Print order is Shipped
Product feature icon Colour book shipped to your preferred address
Product feature icon Redeem a companion digital copy on all Print orders
Product feature icon Access this title in our online reader with advanced features
Product feature icon DRM FREE - Read whenever, wherever and however you want
Product feature icon AI Assistant (beta) to help accelerate your learning
Modal Close icon
Payment Processing...
tick Completed

Shipping Address

Billing Address

Shipping Methods
Estimated delivery fee Deliver to Japan

Standard delivery 10 - 13 business days

$8.95

Premium delivery 3 - 6 business days

$34.95
(Includes tracking information)

Product Details

Publication date : Jul 10, 2026
Length: 536 pages
Edition : 2nd
Language : English
ISBN-13 : 9781806662036
Category :
Languages :

Packt Subscriptions

See our plans and pricing
Modal Close icon
$19.99 billed monthly
Feature tick icon Unlimited access to Packt's library of 7,000+ practical books and videos
Feature tick icon Constantly refreshed with 50+ new titles a month
Feature tick icon Exclusive Early access to books as they're written
Feature tick icon Solve problems while you work with advanced search and reference features
Feature tick icon Offline reading on the mobile app
Feature tick icon Simple pricing, no contract
$199.99 billed annually
Feature tick icon Unlimited access to Packt's library of 7,000+ practical books and videos
Feature tick icon Constantly refreshed with 50+ new titles a month
Feature tick icon Exclusive Early access to books as they're written
Feature tick icon Solve problems while you work with advanced search and reference features
Feature tick icon Offline reading on the mobile app
Feature tick icon Choose a DRM-free eBook or Video every month to keep
Feature tick icon PLUS own as many other DRM-free eBooks or Videos as you like for just $5 each
Feature tick icon Exclusive print discounts
$279.99 billed in 18 months
Feature tick icon Unlimited access to Packt's library of 7,000+ practical books and videos
Feature tick icon Constantly refreshed with 50+ new titles a month
Feature tick icon Exclusive Early access to books as they're written
Feature tick icon Solve problems while you work with advanced search and reference features
Feature tick icon Offline reading on the mobile app
Feature tick icon Choose a DRM-free eBook or Video every month to keep
Feature tick icon PLUS own as many other DRM-free eBooks or Videos as you like for just $5 each
Feature tick icon Exclusive print discounts

Table of Contents

18 Chapters
Chapter 1: Acquire Free Financial Market Data with Cutting-Edge Python Libraries Chevron down icon Chevron up icon
Chapter 2: Analyze and Transform Financial Market Data with pandas Chevron down icon Chevron up icon
Chapter 3: Accelerate Financial Market Data Analysis with Polars and DuckDB Chevron down icon Chevron up icon
Chapter 4: Visualize Financial Market Data with Matplotlib, Seaborn, and Plotly Dash Chevron down icon Chevron up icon
Chapter 5: Build a Quantamental Research Database with Hedge Fund Tools Chevron down icon Chevron up icon
Chapter 6: Conduct Market Research with Advanced AI and Agentic Workflows Chevron down icon Chevron up icon
Chapter 7: Build Alpha Factors for Stock Portfolios Chevron down icon Chevron up icon
Chapter 8: Vector-Based Backtesting with VectorBT Chevron down icon Chevron up icon
Chapter 9: Event-Based Backtesting Factor Portfolios with Zipline Reloaded Chevron down icon Chevron up icon
Chapter 10: Evaluate Factor Risk and Performance with Alphalens Reloaded Chevron down icon Chevron up icon
Chapter 11: Assess Backtest Risk and Performance Metrics with Pyfolio Chevron down icon Chevron up icon
Chapter 12: Set Up the Interactive Brokers Python API Chevron down icon Chevron up icon
Chapter 13: Manage Orders, Positions, and Portfolios with the IB API Chevron down icon Chevron up icon
Chapter 14: Deploy Strategies to a Live Environment Chevron down icon Chevron up icon
Chapter 15: Advanced Recipes for GPU-Accelerated Trading Research Chevron down icon Chevron up icon
Chapter 16: Unlock Your Exclusive Benefits Chevron down icon Chevron up icon
Other Books You May Enjoy Chevron down icon Chevron up icon
Index Chevron down icon Chevron up icon
Get free access to Packt library with over 7500+ books and video courses for 7 days!
Start Free Trial

FAQs

What is the digital copy I get with my Print order? Chevron down icon Chevron up icon

When you buy any Print edition of our Books, you can redeem (for free) the eBook edition of the Print Book you’ve purchased. This gives you instant access to your book when you make an order via PDF, EPUB or our online Reader experience.

What is the delivery time and cost of print book? Chevron down icon Chevron up icon

Shipping Details

USA:

'

Economy: Delivery to most addresses in the US within 10-15 business days

Premium: Trackable Delivery to most addresses in the US within 3-8 business days

UK:

Economy: Delivery to most addresses in the U.K. within 7-9 business days.
Shipments are not trackable

Premium: Trackable delivery to most addresses in the U.K. within 3-4 business days!
Add one extra business day for deliveries to Northern Ireland and Scottish Highlands and islands

EU:

Premium: Trackable delivery to most EU destinations within 4-9 business days.

Australia:

Economy: Can deliver to P. O. Boxes and private residences.
Trackable service with delivery to addresses in Australia only.
Delivery time ranges from 7-9 business days for VIC and 8-10 business days for Interstate metro
Delivery time is up to 15 business days for remote areas of WA, NT & QLD.

Premium: Delivery to addresses in Australia only
Trackable delivery to most P. O. Boxes and private residences in Australia within 4-5 days based on the distance to a destination following dispatch.

India:

Premium: Delivery to most Indian addresses within 5-6 business days

Rest of the World:

Premium: Countries in the American continent: Trackable delivery to most countries within 4-7 business days

Asia:

Premium: Delivery to most Asian addresses within 5-9 business days

Disclaimer:
All orders received before 5 PM U.K time would start printing from the next business day. So the estimated delivery times start from the next day as well. Orders received after 5 PM U.K time (in our internal systems) on a business day or anytime on the weekend will begin printing the second to next business day. For example, an order placed at 11 AM today will begin printing tomorrow, whereas an order placed at 9 PM tonight will begin printing the day after tomorrow.


Unfortunately, due to several restrictions, we are unable to ship to the following countries:

  1. Afghanistan
  2. American Samoa
  3. Belarus
  4. Brunei Darussalam
  5. Central African Republic
  6. The Democratic Republic of Congo
  7. Eritrea
  8. Guinea-bissau
  9. Iran
  10. Lebanon
  11. Libiya Arab Jamahriya
  12. Somalia
  13. Sudan
  14. Russian Federation
  15. Syrian Arab Republic
  16. Ukraine
  17. Venezuela
What is custom duty/charge? Chevron down icon Chevron up icon

Customs duty are charges levied on goods when they cross international borders. It is a tax that is imposed on imported goods. These duties are charged by special authorities and bodies created by local governments and are meant to protect local industries, economies, and businesses.

Do I have to pay customs charges for the print book order? Chevron down icon Chevron up icon

The orders shipped to the countries that are listed under EU27 will not bear custom charges. They are paid by Packt as part of the order.

List of EU27 countries: www.gov.uk/eu-eea:

A custom duty or localized taxes may be applicable on the shipment and would be charged by the recipient country outside of the EU27 which should be paid by the customer and these duties are not included in the shipping charges been charged on the order.

How do I know my custom duty charges? Chevron down icon Chevron up icon

The amount of duty payable varies greatly depending on the imported goods, the country of origin and several other factors like the total invoice amount or dimensions like weight, and other such criteria applicable in your country.

For example:

  • If you live in Mexico, and the declared value of your ordered items is over $ 50, for you to receive a package, you will have to pay additional import tax of 19% which will be $ 9.50 to the courier service.
  • Whereas if you live in Turkey, and the declared value of your ordered items is over € 22, for you to receive a package, you will have to pay additional import tax of 18% which will be € 3.96 to the courier service.
How can I cancel my order? Chevron down icon Chevron up icon

Cancellation Policy for Published Printed Books:

You can cancel any order within 1 hour of placing the order. Simply contact customercare@packt.com with your order details or payment transaction id. If your order has already started the shipment process, we will do our best to stop it. However, if it is already on the way to you then when you receive it, you can contact us at customercare@packt.com using the returns and refund process.

Please understand that Packt Publishing cannot provide refunds or cancel any order except for the cases described in our Return Policy (i.e. Packt Publishing agrees to replace your printed book because it arrives damaged or material defect in book), Packt Publishing will not accept returns.

What is your returns and refunds policy? Chevron down icon Chevron up icon

Return Policy:

We want you to be happy with your purchase from Packtpub.com. We will not hassle you with returning print books to us. If the print book you receive from us is incorrect, damaged, doesn't work or is unacceptably late, please contact Customer Relations Team on customercare@packt.com with the order number and issue details as explained below:

  1. If you ordered (eBook, Video or Print Book) incorrectly or accidentally, please contact Customer Relations Team on customercare@packt.com within one hour of placing the order and we will replace/refund you the item cost.
  2. Sadly, if your eBook or Video file is faulty or a fault occurs during the eBook or Video being made available to you, i.e. during download then you should contact Customer Relations Team within 14 days of purchase on customercare@packt.com who will be able to resolve this issue for you.
  3. You will have a choice of replacement or refund of the problem items.(damaged, defective or incorrect)
  4. Once Customer Care Team confirms that you will be refunded, you should receive the refund within 10 to 12 working days.
  5. If you are only requesting a refund of one book from a multiple order, then we will refund you the appropriate single item.
  6. Where the items were shipped under a free shipping offer, there will be no shipping costs to refund.

On the off chance your printed book arrives damaged, with book material defect, contact our Customer Relation Team on customercare@packt.com within 14 days of receipt of the book with appropriate evidence of damage and we will work with you to secure a replacement copy, if necessary. Please note that each printed book you order from us is individually made by Packt's professional book-printing partner which is on a print-on-demand basis.

What tax is charged? Chevron down icon Chevron up icon

Currently, no tax is charged on the purchase of any print book (subject to change based on the laws and regulations). A localized VAT fee is charged only to our European and UK customers on eBooks, Video and subscriptions that they buy. GST is charged to Indian customers for eBooks and video purchases.

What payment methods can I use? Chevron down icon Chevron up icon

You can pay with the following card types:

  1. Visa Debit
  2. Visa Credit
  3. MasterCard
  4. PayPal
What is the delivery time and cost of print books? Chevron down icon Chevron up icon

Shipping Details

USA:

'

Economy: Delivery to most addresses in the US within 10-15 business days

Premium: Trackable Delivery to most addresses in the US within 3-8 business days

UK:

Economy: Delivery to most addresses in the U.K. within 7-9 business days.
Shipments are not trackable

Premium: Trackable delivery to most addresses in the U.K. within 3-4 business days!
Add one extra business day for deliveries to Northern Ireland and Scottish Highlands and islands

EU:

Premium: Trackable delivery to most EU destinations within 4-9 business days.

Australia:

Economy: Can deliver to P. O. Boxes and private residences.
Trackable service with delivery to addresses in Australia only.
Delivery time ranges from 7-9 business days for VIC and 8-10 business days for Interstate metro
Delivery time is up to 15 business days for remote areas of WA, NT & QLD.

Premium: Delivery to addresses in Australia only
Trackable delivery to most P. O. Boxes and private residences in Australia within 4-5 days based on the distance to a destination following dispatch.

India:

Premium: Delivery to most Indian addresses within 5-6 business days

Rest of the World:

Premium: Countries in the American continent: Trackable delivery to most countries within 4-7 business days

Asia:

Premium: Delivery to most Asian addresses within 5-9 business days

Disclaimer:
All orders received before 5 PM U.K time would start printing from the next business day. So the estimated delivery times start from the next day as well. Orders received after 5 PM U.K time (in our internal systems) on a business day or anytime on the weekend will begin printing the second to next business day. For example, an order placed at 11 AM today will begin printing tomorrow, whereas an order placed at 9 PM tonight will begin printing the day after tomorrow.


Unfortunately, due to several restrictions, we are unable to ship to the following countries:

  1. Afghanistan
  2. American Samoa
  3. Belarus
  4. Brunei Darussalam
  5. Central African Republic
  6. The Democratic Republic of Congo
  7. Eritrea
  8. Guinea-bissau
  9. Iran
  10. Lebanon
  11. Libiya Arab Jamahriya
  12. Somalia
  13. Sudan
  14. Russian Federation
  15. Syrian Arab Republic
  16. Ukraine
  17. Venezuela
Modal Close icon
Modal Close icon