


3D CHARTS IN MATPLOTLIB
Listing 5.25 displays the content of matplot_3d.py that illustrates how to render a 3D plot in Matplotlib.
LISTING 5.25: matplot_3d.py
import matplotlib.pyplot as plt
import numpy as np

zline = np.linspace(0,40,1000)
xline = 2*np.sin(2*zline)
yline = 3*np.cos(3*zline)

ax = plt.axes(projection="3d")
ax.plot3D(xline,yline,zline,'red',linewidth=4)
plt.show()
Listing 5.25 contains import statements, followed by the variables zline, xline, and yline that are initialized via the NumPy methods linspace(), sin(), and cos(), respectively. The next portion of Listing 5.25 initializes the variable ax in order to display a 3D effort, which is rendered by the final code snippet. Launch the code in Listing 5.25, and you will see the image that is shown in Figure 5.23.
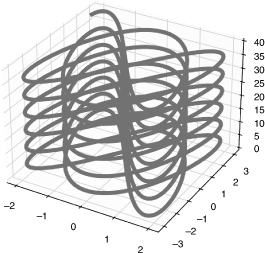
FIGURE 5.23 A 3D plot


