Reader small image

You're reading from  Data Modeling with Microsoft Excel

Product typeBook
Published inNov 2023
PublisherPackt
ISBN-139781803240282
Edition1st Edition
Right arrow
Author (1)
Bernard Obeng Boateng
author image
Bernard Obeng Boateng

Bernard Obeng Boateng is a Microsoft Excel MVP, Microsoft Certified Trainer, with over 10 years work experience in Banking, Insurance and Business Development. He is founder of Finex Skills Hub an approved Training Provider of the Financial Modeling Institute, Canada. Finex Skills Hub runs the Finex Project in Ghana, a pro bono student training outreach program for students in Data Analytics and Financial Modeling. Bernard also provides consultancy services for SMEs (start-ups and existing) in Financial Management, Business Planning and Research. He has an active audience online with about 17,000 followers on his LinkedIn Account. where he shares tips and tricks on Microsoft Excel and other Office Apps.
Read more about Bernard Obeng Boateng

Right arrow

Creating DAX Calculations from Your Data Model – Introduction to Measures and Calculated Columns

We are halfway through our journey to creating a dynamic sales dashboard that will give users insights into our sales business. After extracting, transforming, loading, and modeling our data, we now have to measure our sales performance. To do this, we need to calculate some key metrics. These metrics will help us create visualizations using some of the various dimensions in our data model.

In this chapter, you will learn the key differences between measures and calculated columns, understand the various ways to create a Data Analysis Expressions (DAX) measure in Excel, master some key DAX functions and concepts, and apply these to our final sales dashboard.

The following topics will be covered in this chapter:

  • DAX as a calculated column or measure
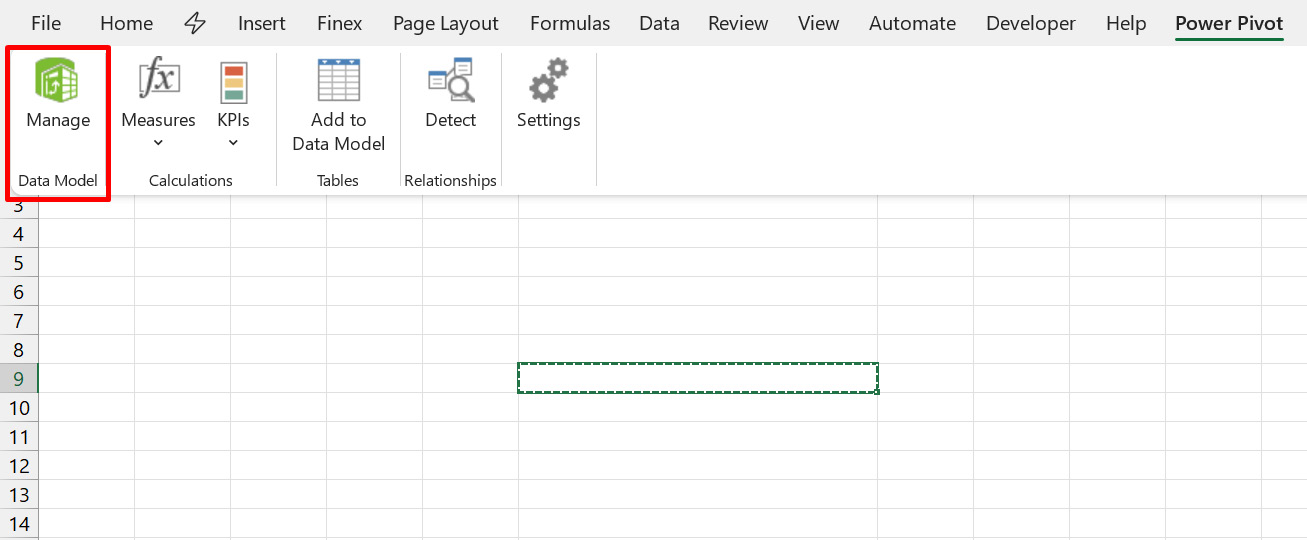
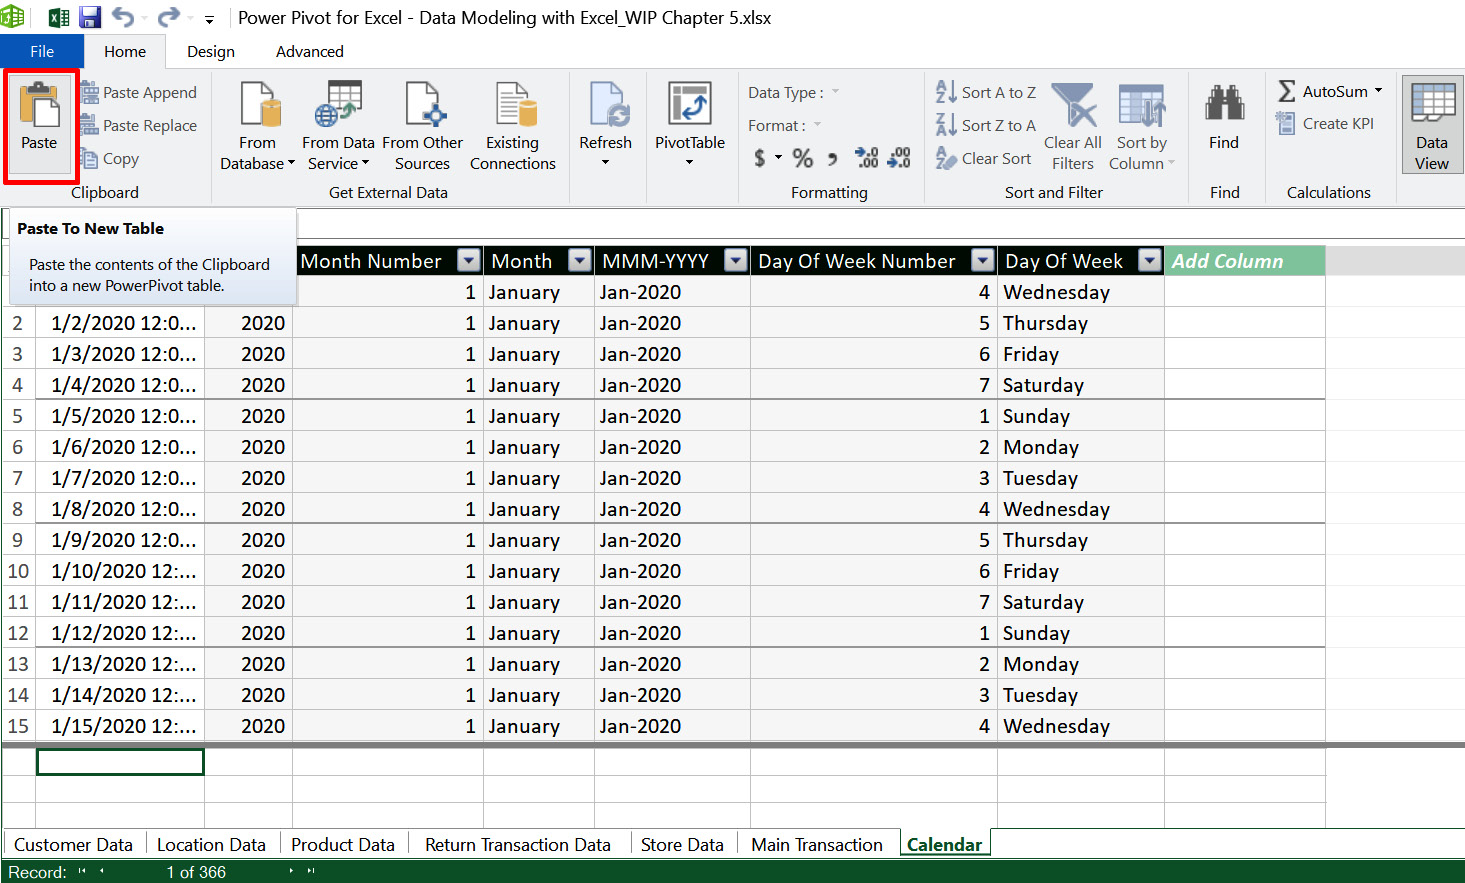
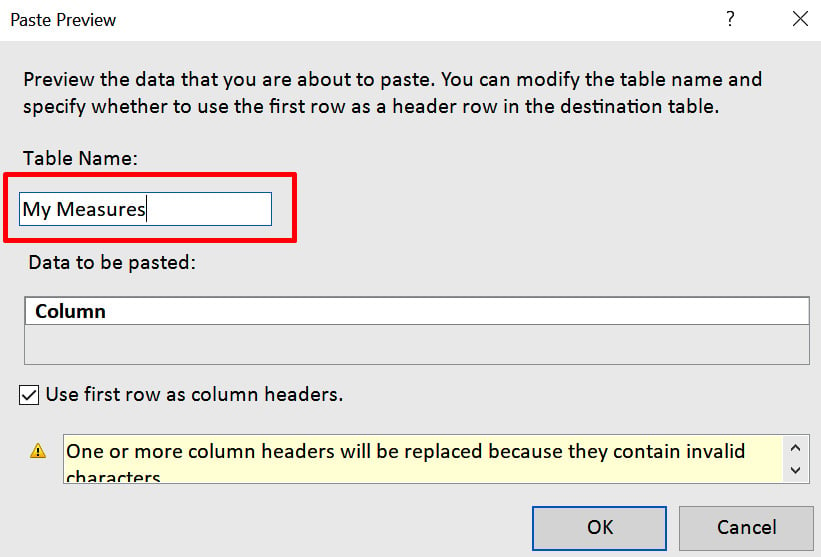
  • Creating your first measure—where to go
  • Common DAX functions (time intelligence, FILTER, CALCULATE, and...

DAX as a calculated column or measure

After creating our data model, we need to calculate some key numbers to track performance. There are some basic calculations we can create from the columns with values in our data model, using functions such as SUM, AVERAGE, MAX, MIN, and so on.

For example, we can find the total quantity of products sold by summing all the values in the Quantity column of our Main Transaction table.

There are measures we can create by simply dragging existing columns or fields to the Values section of a PivotTable. These measures are called implicit measures, while the ones we create with formulas that can be accessed and reused in any part of our data model are called explicit measures. Explicit measures can be created using DAX. DAX is the formula language of a data model. In the data model, we can create two types of DAX calculations: calculated columns and measures.

In an earlier chapter, we learned how to create calculated columns. In this chapter...

Creating your first measure – where to go

Before we create our first measure, it would be a good idea to store all our measures in one table. This will make it easier to organize our measures and separate them from other fields in our data.

To create such a measures table, follow these steps:

  1. Select an empty cell in your worksheet.
  2. Copy the empty cell and click on the Manage button, as shown in the following screenshot:
Figure 5.2 – Creating a table for measures

Figure 5.2 – Creating a table for measures

  1. This should open the Power Pivot window.
  2. Click on Paste under the Home tab:
Figure 5.3 – The Paste dialog box in Power Pivot

Figure 5.3 – The Paste dialog box in Power Pivot

This brings up the following Paste Preview dialog box:

Figure 5.4 – Naming your measures

Figure 5.4 – Naming your measures

You can now assign a new name to the table. In my case, I named it My Measures. Click OK to finish the process.

You should now find a new table pasted in your data...

Common DAX functions (time intelligence, FILTER, CALCULATE, and so on)

There are over 250 DAX functions. We will not be covering all these functions in this book, but we will use and apply the most common functions to our sales dashboard.

Earlier, we calculated our first DAX formula using SUM. SUM falls under the category of DAX functions called aggregation functions. They are responsible for computing scalar values, such as sums, averages, minimums, maximums, and counts, across all rows within a column or table in our data model.

Here are some other categories of DAX functions and what they can be used to calculate:

  • Filter functions: These functions assist in fetching specific data types, searching for values in related tables, and applying filters based on associated values. Lookup functions operate by utilizing tables and their relationships. Filtering functions provide the ability to modify the data context, enabling the creation of dynamic calculations. This includes...

Understanding row and filter contexts

Before we move on to the next set of DAX functions, let’s take a moment to understand the concepts of row and filter contexts.

Understanding this will help you write better DAX formulas.

In Excel, calculations in tables are mostly done in the current row and copied down. When we create calculations that operate on values in every single row of our tables, we are using a row context. What this means is that each row calculates differently based on its unique values. We used row contexts when we created a calculated column for the ages of our customers. The DATEDIFF function runs an operation on the date of birth of each customer “row by row” to return the corresponding age for each customer.

Calculated columns automatically compute within an existing row context. However, when we create measures, this behavior is not there by default, and we need to find some creative ways to select rows for our calculations. This is...

Editing your DAX formulas

You may need to go back to your DAX formulas to make changes. You can easily edit current measures by going to the Power Pivot tab | Measures | Manage Measures…, as seen here:

Figure 5.42 – Editing your measures

Figure 5.42 – Editing your measures

Select the measure you want to edit from the list and click on Edit. This brings you to the Manage Measures dialog box. You can make your changes from here:

Figure 5.43 – The Edit button in the Manage Measures dialog box

Figure 5.43 – The Edit button in the Manage Measures dialog box

Summary

It’s been an exciting journey and introduction to the world of DAX.

We started by understanding the difference between a calculated column and a measure. We explored the Measure dialog box and how the different components can help us create effective DAX formulas.

You are now familiar with some basic DAX functions including SUM, COUNTROWS, CALCULATE, SUMX, RELATED, and some time intelligence functions. You now know how to edit your measures and create simple summary reports using PivotTables.

This is a scratch on the surface of DAX. We will go into more specific calculations in subsequent chapters.

lock icon
The rest of the chapter is locked
You have been reading a chapter from
Data Modeling with Microsoft Excel
Published in: Nov 2023Publisher: PacktISBN-13: 9781803240282
Register for a free Packt account to unlock a world of extra content!
A free Packt account unlocks extra newsletters, articles, discounted offers, and much more. Start advancing your knowledge today.
undefined
Unlock this book and the full library FREE for 7 days
Get unlimited access to 7000+ expert-authored eBooks and videos courses covering every tech area you can think of
Renews at $15.99/month. Cancel anytime

Author (1)

author image
Bernard Obeng Boateng

Bernard Obeng Boateng is a Microsoft Excel MVP, Microsoft Certified Trainer, with over 10 years work experience in Banking, Insurance and Business Development. He is founder of Finex Skills Hub an approved Training Provider of the Financial Modeling Institute, Canada. Finex Skills Hub runs the Finex Project in Ghana, a pro bono student training outreach program for students in Data Analytics and Financial Modeling. Bernard also provides consultancy services for SMEs (start-ups and existing) in Financial Management, Business Planning and Research. He has an active audience online with about 17,000 followers on his LinkedIn Account. where he shares tips and tricks on Microsoft Excel and other Office Apps.
Read more about Bernard Obeng Boateng