Search icon
Arrow left icon
All Products
Best Sellers
New Releases
Books
Videos
Audiobooks
Learning Hub
Newsletters
Free Learning
Arrow right icon
Bayesian Analysis with Python - Third Edition

Bayesian Analysis with Python: A practical guide to probabilistic modeling, Third Edition

By Osvaldo Martin
$39.99 $27.98
Book Jan 2024 394 pages 3rd Edition
eBook
$39.99 $27.98
Print
$49.99
Subscription
$15.99 Monthly
eBook
$39.99 $27.98
Print
$49.99
Subscription
$15.99 Monthly

What do you get with eBook?

Product feature icon Instant access to your Digital eBook purchase
Product feature icon Download this book in EPUB and PDF formats
Product feature icon Access this title in our online reader with advanced features
Product feature icon DRM FREE - Read whenever, wherever and however you want
Buy Now

Product Details


Publication date : Jan 31, 2024
Length 394 pages
Edition : 3rd Edition
Language : English
ISBN-13 : 9781805127161
Category :
Languages :
Table of content icon View table of contents Preview book icon Preview Book

Bayesian Analysis with Python - Third Edition

Chapter 1
Thinking Probabilistically

Probability theory is nothing but common sense reduced to calculation. – Pierre Simon Laplace

In this chapter, we will learn about the core concepts of Bayesian statistics and some of the instruments in the Bayesian toolbox. We will use some Python code, but this chapter will be mostly theoretical; most of the concepts we will see here will be revisited many times throughout this book. This chapter, being heavy on the theoretical side, is perhaps a little anxiogenic for the coder in you, but I think it will ease the path to effectively applying Bayesian statistics to your problems.

In this chapter, we will cover the following topics:

  • Statistical modeling

  • Probabilities and uncertainty

  • Bayes’ theorem and statistical inference

  • Single-parameter inference and the classic coin-flip problem

  • Choosing priors and why people often don’t like them but should

  • Communicating a Bayesian analysis

1.1 Statistics, models, and this book’s approach

Statistics is about collecting, organizing, analyzing, and interpreting data, and hence statistical knowledge is essential for data analysis. Two main statistical methods are used in data analysis:

  • Exploratory Data Analysis (EDA): This is about numerical summaries, such as the mean, mode, standard deviation, and interquartile ranges. EDA is also about visually inspecting the data, using tools you may be already familiar with, such as histograms and scatter plots.

  • Inferential statistics: This is about making statements beyond the current data. We may want to understand some particular phenomenon, maybe we want to make predictions for future (yet unobserved) data points, or we need to choose among several competing explanations for the same set of observations. In summary, inferential statistics allow us to draw meaningful insights from a limited set of data and make informed decisions based on the results of our analysis.

A Match Made in Heaven

The focus of this book is on how to perform Bayesian inferential statistics, but we will also use ideas from EDA to summarize, interpret, check, and communicate the results of Bayesian inference.

Most introductory statistical courses, at least for non-statisticians, are taught as a collection of recipes that go like this: go to the statistical pantry, pick one tin can and open it, add data to taste, and stir until you obtain a consistent p-value, preferably under 0.05. The main goal of these courses is to teach you how to pick the proper can. I never liked this approach, mainly because the most common result is a bunch of confused people unable to grasp, even at the conceptual level, the unity of the different learned methods. We will take a different approach: we will learn some recipes, but they will be homemade rather than canned food; we will learn how to mix fresh ingredients that will suit different statistical occasions and, more importantly, that will let you apply concepts far beyond the examples in this book.

Taking this approach is possible for two reasons:

  • Ontological: Statistics is a form of modeling unified under the mathematical framework of probability theory. Using a probabilistic approach provides a unified view of what may seem like very disparate methods; statistical methods and machine learning methods look much more similar under the probabilistic lens.

  • Technical: Modern software, such as PyMC, allows practitioners, just like you and me, to define and solve models in a relatively easy way. Many of these models were unsolvable just a few years ago or required a high level of mathematical and technical sophistication.

1.2 Working with data

Data is an essential ingredient in statistics and data science. Data comes from several sources, such as experiments, computer simulations, surveys, and field observations. If we are the ones in charge of generating or gathering the data, it is always a good idea to first think carefully about the questions we want to answer and which methods we will use, and only then proceed to get the data. There is a whole branch of statistics dealing with data collection, known as experimental design. In the era of the data deluge, we can sometimes forget that gathering data is not always cheap. For example, while it is true that the Large Hadron Collider (LHC) produces hundreds of terabytes a day, its construction took years of manual and intellectual labor.

As a general rule, we can think of the process of generating the data as stochastic, because there is ontological, technical, and/or epistemic uncertainty, that is, the system is intrinsically stochastic, there are technical issues adding noise or restricting us from measuring with arbitrary precision, and/or there are conceptual limitations veiling details from us. For all these reasons, we always need to interpret data in the context of models, including mental and formal ones. Data does not speak but through models.

In this book, we will assume that we already have collected the data. Our data will also be clean and tidy, something that’s rarely true in the real world. We will make these assumptions to focus on the subject of this book. I just want to emphasize, especially for newcomers to data analysis, that even when not covered in this book, there are important skills that you should learn and practice to successfully work with data.

A very useful skill when analyzing data is knowing how to write code in a programming language, such as Python. Manipulating data is usually necessary given that we live in a messy world with even messier data, and coding helps to get things done. Even if you are lucky and your data is very clean and tidy, coding will still be very useful since modern Bayesian statistics is done mostly through programming languages such as Python or R. If you want to learn how to use Python for cleaning and manipulating data, you can find a good introduction in Python for Data Analysis by McKinney [2022].

1.3 Bayesian modeling

Models are simplified descriptions of a given system or process that, for some reason, we are interested in. Those descriptions are deliberately designed to capture only the most relevant aspects of the system and not to explain every minor detail. This is one reason a more complex model is not always a better one. There are many different kinds of models; in this book, we will restrict ourselves to Bayesian models. We can summarize the Bayesian modeling process using three steps:

  1. Given some data and some assumptions on how this data could have been generated, we design a model by combining building blocks known as probability distributions. Most of the time these models are crude approximations, but most of the time that’s all we need.

  2. We use Bayes’ theorem to add data to our models and derive the logical consequences of combining the data and our assumptions. We say we are conditioning the model on our data.

  3. We evaluate the model, and its predictions, under different criteria, including the data, our expertise on the subject, and sometimes by comparing it to other models.

In general, we will find ourselves performing these three steps in an iterative non-linear fashion. We will retrace our steps at any given point: maybe we made a silly coding mistake, or we found a way to change the model and improve it, or we realized that we need to add more data or collect a different kind of data.

Bayesian models are also known as probabilistic models because they are built using probabilities. Why probabilities? Because probabilities are a very useful tool to model uncertainty; we even have good arguments to state they are the correct mathematical concept. So let’s take a walk through the garden of forking paths [Borges1944].

1.4 A probability primer for Bayesian practitioners

In this section, we are going to discuss a few general and important concepts that are key for better understanding Bayesian methods. Additional probability-related concepts will be introduced or elaborated on in future chapters, as we need them. For a detailed study of probability theory, however, I highly recommend the book Introduction to Probability by Blitzstein [2019]. Those already familiar with the basic elements of probability theory can skip this section or skim it.

1.4.1 Sample space and events

Let’s say we are surveying to see how people feel about the weather in their area. We asked three individuals whether they enjoy sunny weather, with possible responses being “yes” or “no.” The sample space of all possible outcomes can be denoted by S and consists of eight possible combinations:

S = {(yes, yes, yes), (yes, yes, no), (yes, no, yes), (no, yes, yes), (yes, no, no), (no, yes, no), (no, no, yes), (no, no, no)}

Here, each element of the sample space represents the responses of the three individuals in the order they were asked. For example, (yes, no, yes) means the first and third people answered “yes” while the second person answered “no.”

We can define events as subsets of the sample space. For example, event A is when all three individuals answered “yes”:

A = {(yes, yes, yes)}

Similarly, we can define event B as when at least one person answered “no,” and then we will have:

B = {(yes, yes, no), (yes, no, yes), (no, yes, yes), (yes, no, no), (no, yes, no), (no, no, yes), (no, no, no)}

We can use probabilities as a measure of how likely these events are. Assuming all events are equally likely, the probability of event A, which is the event that all three individuals answered “yes,” is:

 number of outcomes in A P (A) = ---------------------------- total number of outcomes in S

In this case, there is only one outcome in A, and there are eight outcomes in S. Therefore, the probability of A is:

 1 P(A ) = 8 = 0.125

Similarly, we can calculate the probability of event B, which is the event that at least one person answered “no.” Since there are seven outcomes in B and eight outcomes in S, the probability of B is:

P(B ) = 7-= 0.875 8

Considering all events equally likely is just a particular case that makes calculating probabilities easier. This is something called the naive definition of probability since it is restrictive and relies on strong assumptions. However, it is still useful if we are cautious when using it. For instance, it is not true that all yes-no questions have a 50-50 chance. Another example. What is the probability of seeing a purple horse? The right answer can vary a lot depending on whether we’re talking about the natural color of a real horse, a horse from a cartoon, a horse dressed in a parade, etc. Anyway, no matter if the events are equally likely or not, the probability of the entire sample space is always equal to 1. We can see that this is true by computing:

 number of outcomes in S P (S) = ---------------------------- total number of outcomes in S

1 is the highest value a probability can take. Saying that P(S) = 1 is saying that S is not only very likely, it is certain. If everything that can happen is defined by S, then S will happen.

If an event is impossible, then its probability is 0. Let’s define the event C as the event of three persons saying “banana”:

C = {(banana, banana, banana)}

As C is not part of S, by definition, it cannot happen. Think of this as the questionnaire from our survey only having two boxes, yes and no. By design, our survey is restricting all other possible options.

We can take advantage of the fact that Python includes sets and define a Python function to compute probabilities following their naive definition:

Code 1.1

def P(S, A): 
    if set(A).issubset(set(S)): 
        return len(A)/len(S) 
    else: 
        return 0

I left for the reader the joy of playing with this function.

One useful way to conceptualize probabilities is as conserved quantities distributed throughout the sample space. This means that if the probability of one event increases, the probability of some other event or events must decrease so that the total probability remains equal to 1. This can be illustrated with a simple example.

Suppose we ask one person whether it will rain tomorrow, with possible responses of “yes” and “no.” The sample space for possible responses is given by S = {yes, no}. An event that will rain tomorrow is represented by A = {yes}. If P(A), is 0.5, then the probability of the complement of event A, denoted by P(Ac), must also be 0.5. If for some reason P(A) increases to 0.8, then P c (A ) must decrease to 0.2. This property holds for disjoint events, which are events that cannot occur simultaneously. For instance, it cannot rain and not rain at the same time tomorrow. You may object that it can rain during the morning and not rain during the afternoon. That is true, but that’s a different sample space!

So far, we have avoided directly defining probabilities, and instead, we have just shown some of their properties and ways to compute them. A general definition of probability that works for non-equally likely events is as follows. Given a sample space S, and the event A, which is a subset of S, a probability is a function P, which takes A as input and returns a real number between 0 and 1, as output. The function P has some restrictions, defined by the following 3 axioms. Keep in mind that an axiom is a statement that is taken to be true and that we use as the starting point in our reasoning:

  1. The probability of an event is a non-negative real number

  2. P(S) = 1

  3. If A1,A2,… are disjoint events, meaning they cannot occur simultaneously then P(A1,A2,…) = P(A1) + P(A2) +

If this were a book on probability theory, we would likely dedicate a few pages to demonstrating the consequences of these axioms and provide exercises for manipulating probabilities. That would help us to become proficient in manipulating probabilities. However, our main focus is not on those topics. My motivation to present these axioms is just to show that probabilities are well-defined mathematical concepts with rules that govern their operations. They are a particular type of function, and there is no mystery surrounding them.

1.4.2 Random variables

A random variable is a function that maps the sample space into the real numbers (see Figure 1.1). Let’s assume the events of interest are the number of a die, the mapping is very simple, we associate PIC with the number 1, PIC with 2, etc. Another simple example is the answer to the question, will it rain tomorrow? We can map “yes” to 1 and “no” to 0. It is common, but not always the case, to use a capital letter for random variables like X and a lowercase letter for their outcomes x. For example, if X represents a single roll of a die, then x represents some specific integer {1,2,3,4,5,6}. Thus, we can write P(X = 3) to indicate the probability of getting the value 3, when rolling a die. We can also leave x unspecified, for instance, we can write P(X = x) to indicate the probability of getting some value x, or P(X x), to indicate the probability of getting a value less than or equal to x.

Being able to map symbols like PIC or strings like “yes” to numbers makes analysis simpler as we already know how to do math with numbers. Random variables are also useful because we can operate with them without directly thinking in terms of the sample space. This feature becomes more and more relevant as the sample space becomes more complex. For example, when simulating molecular systems, we need to specify the position and velocity of each atom; for complex molecules like proteins this means that we will need to track thousands, millions, or even larger numbers. Instead, we can use random variables to summarize certain properties of the system, such as the total energy or the relative angles between certain atoms of the system.

If you are still confused, that’s fine. The concept of a random variable may sound too abstract at the beginning, but we will see plenty of examples throughout the book that will help you cement these ideas. Before moving on, let me try one analogy that I hope you find useful. Random variables are useful in a similar way to how Python functions are useful. We often encapsulate code within functions, so we can store, reuse, and hide complex manipulations of data into a single call. Even more, once we have a few functions, we can sometimes combine them in many ways, like adding the output of two functions or using the output of one function as the input of the other. We can do all this without functions, but abstracting away the inner workings not only makes the code cleaner, it also helps with understanding and fostering new ideas. Random variables play a similar role in statistics.

PIC

Figure 1.1: A random variable X defined on a sample space with 5 elements {S1,⋅⋅⋅S5}, and possible values -1, 2, and π

The mapping between the sample space and is deterministic. There is no randomness involved. So why do we call it a random variable? Because we can ask the variable for values, and every time we ask, we will get a different number. The randomness comes from the probability associated with the events. In Figure 1.1, we have represented P as the size of the circles.

The two most common types of random variables are discrete and continuous ones. Without going into a proper definition, we are going to say that discrete variables take only discrete values and we usually use integers to represent them, like 1, 5, 42. And continuous variables take real values, so we use floats to work with them, like 3.1415, 1.01, 23.4214, and so on. When we use one or the other is problem-dependent. If we ask people about their favorite color, we will get answers like “red,” “blue,” and “green.” This is an example of a discrete random variable. The answers are categories – there are no intermediate values between “red” and “green.” But if we are studying the properties of light absorption, then discrete values like “red” and “green” may not be adequate and instead working with wavelength could be more appropriate. In that case, we will expect to get values like 650 nm and 510 nm and any number in between, including 579.1.

1.4.3 Discrete random variables and their distributions

Instead of calculating the probability that all three individuals answered “yes,” or the probability of getting a 3 when rolling a die, we may be more interested in finding out the list of probabilities for all possible answers or all possible numbers from a die. Once this list is computed, we can inspect it visually or use it to compute other quantities like the probability of getting at least one “no,” the probability of getting an odd number, or the probability of getting a number equal to or larger than 5. The formal name of this list is probability distribution.

We can get the empirical probability distribution of a die, by rolling it a few times and tabulating how many times we got each number. To turn each value into a probability and the entire list into a valid probability distribution, we need to normalize the counts. We can do this by dividing the value we got for each number by the number of times we roll the die.

Empirical distributions are very useful, and we are going to extensively use them. But instead of rolling dice by hand, we are going to use advanced computational methods to do the hard work for us; this will not only save us time and boredom but it will allow us to get samples from really complicated distributions effortlessly. But we are getting ahead of ourselves. Our priority is to concentrate on theoretical distributions, which are central in statistics because, among other reasons, they allow the construction of probabilistic models.

As we saw, there is nothing random or mysterious about random variables; they are just a type of mathematical function. The same goes for theoretical probability distributions. I like to compare probability distributions with circles. Because we are all familiar with circles even before we get into school, we are not afraid of them and they don’t look mysterious to us. We can define a circle as the geometric space of points on a plane that is equidistant from another point called the center. We can go further and provide a mathematical expression for this definition. If we assume the location of the center is irrelevant, then the circle of radius r can simply be described as the set of all points (x,y) such that:

x2 + y2 = r2

From this expression, we can see that given the parameter r, the circle is completely defined. This is all we need to plot it and all we need to compute properties such as the perimeter, which is 2πr.

Now notice that all circles look very similar to each other and that any two circles with the same value of r are essentially the same objects. Thus we can think of the family of circles, where each member is set apart from the rest precisely by the value of r.

So far, so good, but why are we talking about circles? Because all this can be directly applied to probability distributions. Both circles and probability distributions have mathematical expressions that define them, and these expressions have parameters that we can change to define all members of a family of probability distributions. Figure 1.2 shows four members of one probability distribution known as BetaBinomial. In Figure 1.2, the height of the bars represents the probability of each x value. The values of x below 1 or above 6 have a probability of 0 as they are out of the support of the distribution.

PIC

Figure 1.2: Four members of the BetaBinomial distribution with parameters α and β

This is the mathematical expression for the BetaBinomial distribution:

 ( ) pmf (x ) = n- B-(x-+-𝛼,n-−-x-+-𝛽)- x B(𝛼,𝛽 )

pmf stands for probability mass function. For discrete random variables, the pmf is the function that returns probabilities. In mathematical notation, if we have a random variable X, then pmf(x) = P(X = x).

Understanding or remembering the pmf of the BetaBinomial has zero importance for us. I’m just showing it here so you can see that this is just another function; you put in one number and you get out another number. Nothing weird, at least not in principle. I must concede that to fully understand the details of the BetaBinomial distribution, we need to know what ( ) nx is, known as the binomial coefficient, and what B is, the Beta function. But that’s not fundamentally different from showing x2 + y2 = r2.

Mathematical expressions can be super useful, as they are concise and we can use them to derive properties from them. But sometimes that can be too much work, even if we are good at math. Visualization can be a good alternative (or complement) to help us understand probability distributions. I cannot fully show this on paper, but if you run the following, you will get an interactive plot that will update every time you move the sliders for the parameters alpha, beta, and n:

Code 1.2

pz.BetaBinomial(alpha=10, beta=10, n=6).plot_interactive()

Figure 1.3 shows a static version of this interactive plot. The black dots represent the probabilities for each value of the random variable, while the dotted black line is just a visual aid.

PIC

Figure 1.3: The output of pz.BetaBinomial(alpha=10, beta=10, n=6).plot_interactive()

On the x-axis, we have the support of the BetaBinomial distribution, i.e., the values it can take, x ∈{0,1,2,3,4,5}. On the y-axis, the probabilities associated with each of those values. The full list is shown in Table 1.1.

x value probability
0 0.047
1 0.168
2 0.285
3 0.285
4 0.168
5 0.047

Table 1.1: Probabilities for pz.BetaBinomial(alpha=10, beta=10, n=6)

Notice that for a BetaBinomial(alpha=10, beta=10, n=6) distribution, the probability of values not in {0,1,2,3,4,5}, including values such as 1,0.5,π,42, is 0.

We previously mentioned that we can ask a random variable for values and every time we ask, we will get a different number. We can simulate this with PreliZ [Icazatti et al.2023], a Python library for prior elicitation. Take the following code snippet for instance:

Code 1.3

pz.BetaBinomial(alpha=10, beta=10, n=6).rvs()

This will give us an integer between 0 and 5. Which one? We don’t know! But let’s run the following code:

Code 1.4

plt.hist(pz.BetaBinomial(alpha=2, beta=5, n=5).rvs(1000)) 
pz.BetaBinomial(alpha=2, beta=5, n=5).plot_pdf();

We will get something similar to Figure 1.4. Even when we cannot predict the next value from a random variable, we can predict the probability of getting any particular value and by the same token, if we get many values, we can predict their overall distribution.

PIC

Figure 1.4: The gray dots represent the pmf of the BetaBinomial sample. In light gray, a histogram of 1,000 draws from that distribution

In this book, we will sometimes know the parameters of a given distribution and we will want to get random samples from it. Other times, we are going to be in the opposite scenario: we will have a set of samples and we will want to estimate the parameters of a distribution. Playing back and forth between these two scenarios will become second nature as we move forward through the pages.

1.4.4 Continuous random variables and their distributions

Probably the most widely known continuous probability distribution is the Normal distribution, also known as the Gaussian distribution. Its probability density function is:

 { } 1 1( x − μ)2 pdf(x) = -√----exp − -- ----- σ 2π 2 σ

Again, we only show this expression to remove the mystery veil. No need to pay too much attention to its details, other than to the fact that this distribution has two parameters μ, which controls the location of the peak of the curve, and σ, which controls the spread of the curve. Figure 1.5 shows 3 examples from the Gaussian family. If you want to learn more about this distribution, I recommend you watch this video: https://www.youtube.com/watch?v=cy8r7WSuT1I.

PIC

Figure 1.5: Three members of the Gaussian family

If you have been paying attention, you may have noticed that we said probability density function (pdf) instead of probability mass function (pmf). This was no typo – they are actually two different objects. Let’s take one step back and think about this; the output of a discrete probability distribution is a probability. The height of the bars in Figure 1.2 or the height of the dots in Figure 1.3 are probabilities. Each bar or dot will never be higher than 1 and if you sum all the bars or dots, you will always get 1. Let’s do the same but with the curve in Figure 1.5. The first thing to notice is that we don’t have bars or dots; we have a continuous, smooth curve. So maybe we can think that the curve is made up of super thin bars, so thin that we assign one bar for every real value in the support of the distributions, we measure the height of each bar, and we perform an infinite sum. This is a sensible thing to do, right?

Well yes, but it is not immediately obvious what are we going to get from this. Will this sum give us exactly 1? Or are we going to get a large number instead? Is the sum finite? Or does the result depend on the parameters of the distribution?

A proper answer to these questions requires measure theory, and this is a very informal introduction to probability, so we are not going into that rabbit hole. But the answer essentially is that for a continuous random variable, we can only assign a probability of 0 to every individual value it may take; instead, we can assign densities to them and then we can calculate probabilities for a range of values. Thus, for a Gaussian, the probability of getting exactly the number -2, i.e. the number -2 followed by an infinite number of zeros after the decimal point, is 0. But the probability of getting a number between -2 and 0 is some number larger than 0 and smaller than 1. To find out the exact answer, we need to compute the following:

 ∫ b P(a < X < b) = pdf(x)dx a

And to compute that, we need to replace the symbols for a concrete quantity. If we replace the pdf by Normal(0,1), and a = 2, b = 0, we will get that P(2 < X < 0) 0.477, which is the shaded area in Figure 1.6.

PIC

Figure 1.6: The black line represents the pdf of a Gaussian with parameters mu=0 and sigma=1, the gray area is the probability of a value being larger than -2 and smaller than 0

You may remember that we can approximate an integral by summing areas of rectangles and the approximation becomes more and more accurate as we reduce the length of the base of the rectangles (see the Wikipedia entry for Riemann integral). Based on this idea and using PreliZ, we can estimate P(2 < X < 0) as:

Code 1.5

dist = pz.Normal(0, 1) 
a = -2 
b = 0 
num = 10 
x_s = np.linspace(a, b, num) 
base = (b-a)/num 
np.sum(dist.pdf(x_s) * base)

If we increase the value of num, we will get a better approximation.

1.4.5 Cumulative distribution function

We have seen the pmf and the pdf, but these are not the only ways to characterize distributions. An alternative is the cumulative distribution function (cdf). The cdf of a random variable X is the function FX given by FX(x) = P(X x). In words, the cdf is the answer to the question: what is the probability of getting a number lower than or equal to x? On the first column of Figure 1.7, we can see the pmf and cdf of a BetaBinomial, and in the second column, the pdf and cdf of a Gaussian. Notice how the cdf jumps for the discrete variable but it is smooth for the continuous variable. The height of each jump represents a probability – just compare them with the height of the dots. We can use the plot of the cdf of a continuous variable as visual proof that probabilities are zero for any value of the continuous variable. Just notice how there are no jumps for continuous variables, which is equivalent to saying that the height of the jumps is exactly zero.

PIC

Figure 1.7: The pmf of the BetaBinomial distribution with its corresponding cdf and the pdf of the Normal distribution with its corresponding cdf

Just by looking at a cdf, it is easier to find what is the probability of getting a number smaller than, let’s say, 1. We just need to go to the value 1 on the x-axis, move up until we cross the black line, and then check the value of the y-axis. For instance, in Figure 1.7 and for the Normal distribution, we can see that the value lies between 0.75 and 1. Let’s say it is 0.85. This is way harder to do with the pdf because we would need to compare the entire area below 1 to the total area to get the answer. Humans are worse at judging areas than judging heights or lengths.

1.4.6 Conditional probability

Given two events A and B with P(B) > 0, the probability of A given B, which we write as P(A|B) is defined as:

P(A | B ) = P-(A,-B-) P (B)

P(A,B) is the probability that both the event A and event B occur. P(A|B) is known as conditional probability, and it is the probability that event A occurs, conditioned by the fact that we know (or assume, imagine, hypothesize, etc.) that B has occurred. For example, the probability that the pavement is wet is different from the probability that the pavement is wet if we know it’s raining.

A conditional probability can be larger than, smaller than, or equal to the unconditional probability. If knowing B does not provide us with information about A, then P(A|B) = P(A). This will be true only if A and B are independent of each other. On the contrary, if knowing B gives us useful information about A, then the conditional probability could be larger or smaller than the unconditional probability, depending on whether knowing B makes A less or more likely. Let’s see a simple example using a fair six-sided die. What is the probability of getting the number 3 if we roll the die? P(die = 3) = 16 since each of the six numbers has the same chance for a fair six-sided die. And what is the probability of getting the number 3 given that we have obtained an odd number? P(die = 3 | die = {1,3,5}) = 1 3, because if we know we have an odd number, the only possible numbers are {1,3,5} and each of them has the same chance. Finally, what is the probability of getting 3 if we have obtained an even number? This is P(die = 3 | die = {2,4,6}) = 0, because if we know the number is even, then the only possible ones are {2,4,6} and thus getting a 3 is not possible.

As we can see from these simple examples, by conditioning on observed data, we are changing the sample space. When asking about P(die = 3), we need to evaluate the sample space S = {1,2,3,4,5,6}, but when we condition on having got an even number, then the new sample space becomes T = {2,4,6}.

Conditional probabilities are at the heart of statistics, irrespective of whether your problem is rolling dice or building self-driving cars.

The central panel of Figure 1.8 represents p(A,B) using a grayscale with darker colors for higher probability densities. We see the joint distribution is elongated, indicating that the higher the value of A, the higher the one of B, and vice versa. Knowing the value of A tells us something about the values of B and the other way around. On the top and right margins of Figure 1.8 we have the marginal distributions p(A) and p(B) respectively. To compute the marginal of A, we take p(A,B) and we average overall values of B, intuitively this is like taking a 2D object, the joint distribution, and projecting it into one dimension. The marginal distribution of B is computed similarly. The dashed lines represent the conditional probability p(A|B) for 3 different values of B. We get them by slicing the joint p(A,B) at a given value of B. We can think of this as the distribution of A given that we have observed a particular value of B.

PIC

Figure 1.8: Representation of the relationship between the joint p(A,B), the marginals p(A) and p(B), and the conditional p(A|B) probabilities

1.4.7 Expected values

If X is a discrete random variable, we can compute its expected value as:

 ∑ 𝔼 (X ) = xP (X = x) x

This is just the mean or average value.

You are probably used to computing means or averages of samples or collections of numbers, either by hand, on a calculator, or using Python. But notice that here we are not talking about the mean of a bunch of numbers; we are talking about the mean of a distribution. Once we have defined the parameters of a distribution, we can, in principle, compute its expected values. Those are properties of the distribution in the same way that the perimeter is a property of a circle that gets defined once we set the value of the radius.

Another expected value is the variance, which we can use to describe the spread of a distribution. The variance appears naturally in many computations in statistics, but in practice, it is often more useful to use the standard deviation, which is the square root of the variance. The reason is that the standard deviation is in the same units as the random variable.

The mean and variance are often called the moments of a distribution. Other moments are skewness, which tells us about the asymmetry of a distribution, and the kurtosis, which tells us about the behavior of the tails or the extreme values [Westfall2014]. Figure 1.9 shows examples of different distributions and their mean μ, standard deviation σ, skew γ, and kurtosis . Notice that for some distributions, some moments may not be defined or they may be inf.

PIC

Figure 1.9: Four distributions with their first four moments

Now that we have learned about some of the basic concepts and jargon from probability theory, we can move on to the moment everyone was waiting for.

1.4.8 Bayes’ theorem

Without further ado, let’s contemplate, in all its majesty, Bayes’ theorem:

 p(Y-| θ)p(θ) p(θ | Y ) = p(Y)

Well, it’s not that impressive, is it? It looks like an elementary school formula, and yet, paraphrasing Richard Feynman, this is all you need to know about Bayesian statistics. Learning where Bayes’ theorem comes from will help us understand its meaning. According to the product rule, we have:

p (θ,Y ) = p(θ | Y ) p(Y )

This can also be written as:

p(θ,Y) = p(Y | θ) p(θ)

Given that the terms on the left are equal for both equations, we can combine them and write:

p(θ | Y) p(Y) = p(Y | θ) p(θ)

On reordering, we get Bayes’ theorem:

 p(Y | θ)p(θ) p(θ | Y ) =---p(Y)----

Why is Bayes’ theorem that important? Let’s see.

First, it says that p(θ|Y ) is not necessarily the same as p(Y |θ). This is a very important fact – one that is easy to miss in daily situations, even for people trained in statistics and probability. Let’s use a simple example to clarify why these quantities are not necessarily the same. The probability of a person being the Pope given that this person is Argentinian is not the same as the probability of being Argentinian given that this person is the Pope. As there are around 47,000,000 Argentinians alive and a single one of them is the current Pope, we have p(Pope | Argentinian ) 470100000 and we also have p(Argentinian | Pope ) = 1.

If we replace θ with “hypothesis” and Y with “data,” Bayes’ theorem tells us how to compute the probability of a hypothesis, θ, given the data, Y , and that’s the way you will find Bayes’ theorem is explained in a lot of places. But, how do we turn a hypothesis into something that we can put inside Bayes’ theorem? Well, we do it by using probability distributions. So, in general, our hypothesis is a hypothesis in a very, very, very narrow sense; we will be more precise if we talk about finding a suitable value for parameters in our models, that is, parameters of probability distributions. By the way, don’t try to set θ to statements such as ”unicorns are real,” unless you are willing to build a realistic probabilistic model of unicorn existence!

Bayes’ theorem is central to Bayesian statistics. As we will see in Chapter 2, using tools such as PyMC frees us of the need to explicitly write Bayes’ theorem every time we build a Bayesian model. Nevertheless, it is important to know the name of its parts because we will constantly refer to them and it is important to understand what each part means because this will help us to conceptualize models. So, let me rewrite Bayes’ theorem now with labels:

 posterior ◜likeli◞h◟ood◝p◜r◞io◟r◝ ◜--◞◟-◝ p (Y | θ)p(θ) p(θ | Y) =-------------- p◟(◝Y◜)◞ marginal likelihood

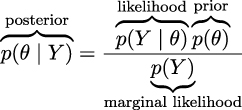
The prior distribution should reflect what we know about the value of the parameter θ before seeing the data, Y . If we know nothing, like Jon Snow, we could use flat priors that do not convey too much information. In general, we can do better than flat priors, as we will learn in this book. The use of priors is why some people still talk about Bayesian statistics as subjective, even when priors are just another assumption that we made when modeling and hence are just as subjective (or objective) as any other assumption, such as likelihoods.

The likelihood is how we will introduce data in our analysis. It is an expression of the plausibility of the data given the parameters. In some texts, you will find people call this term sampling model, statistical model, or just model. We will stick to the name likelihood and we will model the combination of priors and likelihood.

The posterior distribution is the result of the Bayesian analysis and reflects all that we know about a problem (given our data and model). The posterior is a probability distribution for the parameters in our model and not a single value. This distribution is a balance between the prior and the likelihood. There is a well-known joke: a Bayesian is one who, vaguely expecting a horse, and catching a glimpse of a donkey, strongly believes they have seen a mule. One excellent way to kill the mood after hearing this joke is to explain that if the likelihood and priors are both vague, you will get a posterior reflecting vague beliefs about seeing a mule rather than strong ones. Anyway, I like the joke, and I like how it captures the idea of a posterior being somehow a compromise between prior and likelihood. Conceptually, we can think of the posterior as the updated prior in light of (new) data. In theory, the posterior from one analysis can be used as the prior for a new analysis (in practice, life can be harder). This makes Bayesian analysis particularly suitable for analyzing data that becomes available in sequential order. One example could be an early warning system for natural disasters that processes online data coming from meteorological stations and satellites. For more details, read about online machine-learning methods.

The last term is the marginal likelihood, sometimes referred to as the evidence. Formally, the marginal likelihood is the probability of observing the data averaged over all the possible values the parameters can take (as prescribed by the prior). We can write this as Θp(Y |θ)p(θ)dθ. We will not really care about the marginal likelihood until Chapter 5. But for the moment, we can think of it as a normalization factor that ensures the posterior is a proper pmf or pdf. If we ignore the marginal likelihood, we can write Bayes’ theorem as a proportionality, which is also a common way to write Bayes’ theorem:

p(θ | Y ) ∝ p(Y | θ)p(θ)

Understanding the exact role of each term in Bayes’ theorem will take some time and practice, and it will require a few examples, but that’s what the rest of this book is for.

1.5 Interpreting probabilities

Probabilities can be interpreted in various useful ways. For instance, we can think that P(A) = 0.125 means that if we repeat the survey many times, we would expect all three individuals to answer “yes” about 12.5% of the time. We are interpreting probabilities as the outcome of long-run experiments. This is a very common and useful interpretation. It not only can help us think about probabilities but can also provide an empirical method to estimate probabilities. Do we want to know the probability of a car tire exploding if filled with air beyond the manufacturer’s recommendation? Just inflate 120 tires or so, and you may get a good approximation. This is usually called the frequentist interpretation.

Another interpretation of probability, usually called subjective or Bayesian interpretation, states that probabilities can be interpreted as measures of an individual’s uncertainty about events. In this interpretation, probabilities are about our state of knowledge of the world and are not necessarily based on repeated trials. Under this definition of probability, it is valid and natural to ask about the probability of life on Mars, the probability of the mass of an electron being 9.1 × 1031 kg, or the probability that the 9th of July of 1816 was a sunny day in Buenos Aires. All these are one-time events. We cannot re-create 1 million universes, each with one Mars, and check how many of them develop life. Of course, we can do this as a mental experiment, so long-term frequencies can still be a valid mental scaffold.

Sometimes the Bayesian interpretation of probabilities is described in terms of personal beliefs; I don’t like that. I think it can lead to unnecessary confusion as beliefs are generally associated with the notion of faith or unsupported claims. This association can easily lead people to think that Bayesian probabilities, and by extension Bayesian statistics, is less objective or less scientific than alternatives. I think it also helps to generate confusion about the role of prior knowledge in statistics and makes people think that being objective or rational means not using prior information.

Bayesian methods are as subjective (or objective) as any other well-established scientific method we have. Let me explain myself with an example: life on Mars exists or does not exist; the outcome is binary, a yes-no question. But given that we are not sure about that fact, a sensible course of action is trying to find out how likely life on Mars is. To answer this question any honest and scientific-minded person will use all the relevant geophysical data about Mars, all the relevant biochemical knowledge about necessary conditions for life, and so on. The response will be necessarily about our epistemic state of knowledge, and others could disagree and even get different probabilities. But at least, in principle, they all will be able to provide arguments in favor of their data, their methods, their modeling decisions, and so on. A scientific and rational debate about life on Mars does not admit arguments such as ”an angel told me about tiny green creatures.” Bayesian statistics, however, is just a procedure to make scientific statements using probabilities as building blocks.

1.6 Probabilities, uncertainty, and logic

Probabilities can help us to quantify uncertainty. If we do not have information about a problem, it is reasonable to state that every possible event is equally likely. This is equivalent to assigning the same probability to every possible event. In the absence of information, our uncertainty is maximum, and I am not saying this colloquially; this is something we can compute using probabilities. If we know instead that some events are more likely, then this can be formally represented by assigning a higher probability to those events and less to the others. Notice that when we talk about events in stats-speak, we are not restricting ourselves to things that can happen, such as an asteroid crashing into Earth or my auntie’s 60th birthday party. An event is just any of the possible values (or a subset of values) a variable can take, such as the event that you are older than 30, the price of a Sachertorte, or the number of bikes that will be sold next year around the world.

The concept of probability is also related to the subject of logic. Under classical logic, we can only have statements that take the values of true or false. Under the Bayesian definition of probability, certainty is just a special case: a true statement has a probability of 1, and a false statement has a probability of 0. We would assign a probability of 1 to the statement that there is Martian life only after having conclusive data indicating something is growing, reproducing, and doing other activities we associate with living organisms.

Notice, however, that assigning a probability of 0 is harder because we could always think that there is some Martian spot that is unexplored, or that we have made mistakes with some experiments, or there are several other reasons that could lead us to falsely believe life is absent on Mars even if it is not. This is related to Cromwell’s rule, which states that we should reserve the probabilities of 0 or 1 to logically true or false statements. Interestingly enough, it can be shown that if we want to extend the logic to include uncertainty, we must use probabilities and probability theory.

As we will soon see, Bayes’ theorem is just a logical consequence of the rules of probability. Thus, we can think of Bayesian statistics as an extension of logic that is useful whenever we are dealing with uncertainty. Thus, one way to justify using the Bayesian method is to recognize that uncertainty is commonplace. We generally have to deal with incomplete and or noisy data, we are intrinsically limited by our evolution-sculpted primate brain, and so on.

The Bayesian Ethos

Probabilities are used to measure the uncertainty we have about parameters, and Bayes’ theorem is a mechanism to correctly update those probabilities in light of new data, hopefully reducing our uncertainty.

1.7 Single-parameter inference

Now that we know what Bayesian statistics is, let’s learn how to do Bayesian statistics with a simple example. We are going to begin inferring a single, unknown parameter.

1.7.1 The coin-flipping problem

The coin-flipping problem, or the BetaBinomial model if you want to sound fancy at parties, is a classical problem in statistics and goes like this: we toss a coin several times and record how many heads and tails we get. Based on this data, we try to answer questions such as, is the coin fair? Or, more generally, how biased is the coin? While this problem may sound dull, we should not underestimate it.

The coin-flipping problem is a great example to learn the basics of Bayesian statistics because it is a simple model that we can solve and compute with ease. Besides, many real problems consist of binary, mutually exclusive outcomes such as 0 or 1, positive or negative, odds or evens, spam or ham, hotdog or not a hotdog, cat or dog, safe or unsafe, and healthy or unhealthy. Thus, even when we are talking about coins, this model applies to any of those problems. To estimate the bias of a coin, and in general, to answer any questions in a Bayesian setting, we will need data and a probabilistic model. For this example, we will assume that we have already tossed a coin several times and we have a record of the number of observed heads, so the data-gathering part is already done. Getting the model will take a little bit more effort. Since this is our first model, we will explicitly write Bayes’ theorem and do all the necessary math (don’t be afraid, I promise it will be painless) and we will proceed very slowly. From 2 onward, we will use PyMC and our computer to do the math for us.

The first thing we will do is generalize the concept of bias. We will say that a coin with a bias of 1 will always land heads, one with a bias of 0 will always land tails, and one with a bias of 0.5 will land heads half of the time and tails half of the time. To represent the bias, we will use the parameter θ, and to represent the total number of heads for several tosses, we will use the variable Y . According to Bayes’ theorem, we have to specify the prior, p(θ), and likelihood, p(Y |θ), we will use. Let’s start with the likelihood.

1.7.2 Choosing the likelihood

Let’s assume that only two outcomes are possible—heads or tails—and let’s also assume that a coin toss does not affect other tosses, that is, we are assuming coin tosses are independent of each other. We will further assume all coin tosses come from the same distribution. Thus the random variable coin toss is an example of an independent and identically distributed (iid) variable. I hope you agree that these are very reasonable assumptions to make for our problem. Given these assumptions, a good candidate for the likelihood is the Binomial distribution:

 ----N-!--- y N− y p(Y | θ) = y!(N − y)! θ (1 − θ) ◟---◝◜---◞ normalizing constant

This is a discrete distribution returning the probability of getting y heads (or, in general, successes) out of N coin tosses (or, in general, trials or experiments) given a fixed value of θ.

Figure 1.10 shows nine distributions from the Binomial family; each subplot has its legend indicating the values of the parameters. Notice that for this plot, I did not omit the values on the y-axis. I did this so you can check for yourself that if you sum the height of all bars, you will get 1, that is, for discrete distributions, the height of the bars represents actual probabilities.

PIC

Figure 1.10: Nine members of the Binomial family

The Binomial distribution is a reasonable choice for the likelihood. We can see that θ indicates how likely it is to obtain a head when tossing a coin. This is easier to see when N = 1 but is valid for any value of N, just compare the value of θ with the height of the bar for y = 1 (heads).

1.7.3 Choosing the prior

As a prior, we will use a Beta distribution, which is a very common distribution in Bayesian statistics and looks as follows:

p(θ) = --Γ (𝛼-+-𝛽)- θ𝛼−1(1− θ)𝛽−1 Γ◟-(𝛼-)+◝◜Γ (𝛽)◞ normalizing constant

If we look carefully, we will see that the Beta distribution looks similar to the Binomial except for the first term. Γ is the Greek uppercase gamma letter, which represents the gamma function, but that’s not really important. What is relevant for us is that the first term is a normalizing constant that ensures the distribution integrates to 1. We can see from the preceding formula that the Beta distribution has two parameters, α and β. Figure 1.11 shows nine members of the Beta family.

PIC

Figure 1.11: Nine members of the Beta family

I like the Beta distribution and all the shapes we can get from it, but why are we using it for our model? There are many reasons to use a Beta distribution for this and other problems. One of them is that the Beta distribution is restricted to be between 0 and 1, in the same way our θ parameter is. In general, we use the Beta distribution when we want to model the proportions of a Binomial variable. Another reason is its versatility. As we can see in Figure 1.11, the distribution adopts several shapes (all restricted to the [0,1] interval), including a Uniform distribution, Gaussian-like distributions, and U-like distributions.

As a third reason, the Beta distribution is the conjugate prior to the Binomial distribution (which we are using as the likelihood). A conjugate prior of a likelihood is a prior that, when used in combination with a given likelihood, returns a posterior with the same functional form as the prior. Untwisting the tongue, every time we use a Beta distribution as the prior and a Binomial distribution as the likelihood, we will get a Beta as the posterior distribution. There are other pairs of conjugate priors; for example, the Normal distribution is the conjugate prior to itself. For many years, Bayesian analysis was restricted to the use of conjugate priors. Conjugacy ensures mathematical tractability of the posterior, which is important given that a common problem in Bayesian statistics ends up with a posterior we cannot solve analytically. This was a deal breaker before the development of suitable computational methods to solve probabilistic methods. From Chapter 2 onwards, we will learn how to use modern computational methods to solve Bayesian problems, whether we choose conjugate priors or not.

1.7.4 Getting the posterior

Let’s remember that Bayes’ theorem says the posterior is proportional to the likelihood times the prior. So, for our problem, we have to multiply the Binomial and the Beta distributions:

 likelihood prior ◜---------◞◟---------◝ ◜----------◞◟-----------◝ p(θ | Y ) =---N-!---θy(1− θ)N −y -Γ-(𝛼+-𝛽-)-θ𝛼− 1(1 − θ)𝛽−1 y!(N − y )! Γ (𝛼) + Γ (𝛽)

We can simplify this expression by dropping all the terms that do not depend on θ and our results will still be valid. Accordingly, we can write:

 -likelihood--- -----prior---- ◜y ◞◟ N −◝y ◜𝛼−1 ◞◟ 𝛽−◝1 p(θ | Y) ∝ θ)

Reordering it, and noticing this has the form of a Beta distribution, we get:

p(θ | Y ) = Beta (𝛼prior + y,𝛽prior+N −y)

Based on this analytical expression, we can compute the posterior. Figure 1.12 shows the results for 3 priors and different numbers of trials. The following block of code shows the gist to generate Figure 1.12 (omitting the code necessary for plotting).

Code 1.6

n_trials = [0, 1, 2, 3, 4, 8, 16, 32, 50, 150] 
n_heads = [0, 1, 1, 1, 1, 4, 6, 9, 13, 48] 
beta_params = [(1, 1), (20, 20), (1, 4)] 
 
x = np.linspace(0, 1, 2000) 
for idx, N in enumerate(n_trials): 
    y = n_heads[idx] 
    for (α_prior, β_prior) in beta_params: 
        posterior = pz.Beta(α_prior + y, β_prior + N - y).pdf(x)
PIC

Figure 1.12: The first subplot shows 3 priors. The rest show successive updates as we get new data

On the first subplot of Figure 1.12, we have zero trials, thus the three curves represent our priors:

  • The Uniform prior (black): This represents all the possible values for the bias being equally probable a priori.

  • The Gaussian-like prior (dark gray): This is centered and concentrated around 0.5, so this prior is compatible with information indicating that the coin has more or less about the same chance of landing heads or tails. We could also say this prior is compatible with the knowledge that coins are fair.

  • The skewed prior (light gray): This puts most of the weight on a tail-biased outcome.

The rest of the subplots show posterior distributions for successive trials. The number of trials (or coin tosses) and the number of heads are indicated in each subplot’s legend. There is also a black dot at 0.35 representing the true value for θ. Of course, in real problems, we do not know this value, and it is here just for pedagogical reasons. Figure 1.12, can teach us a lot about Bayesian analysis, so grab your coffee, tea, or favorite drink, and let’s take a moment to understand it:

  • The result of a Bayesian analysis is a posterior distribution – not a single value but a distribution of plausible values given the data and our model.

  • The most probable value is given by the mode of the posterior (the peak of the distribution).

  • The spread of the posterior is proportional to the uncertainty about the value of a parameter; the more spread out the distribution, the less certain we are.

  • Intuitively, we are more confident in a result when we have observed more data supporting that result. Thus, even when numerically 1 2 = 48 = 0.5, seeing four heads out of eight trials gives us more confidence that the bias is 0.5 than observing one head out of two trials. This intuition is reflected in the posterior, as you can check for yourself if you pay attention to the (black) posterior in the third and sixth subplots; while the mode is the same, the spread (uncertainty) is larger in the third subplot than in the sixth subplot.

  • Given a sufficiently large amount of data, two or more Bayesian models with different priors will tend to converge to the same result. In the limit of infinite data, no matter which prior we use, all of them will provide the same posterior.

  • Remember that infinite is a limit and not a number, so from a practical point of view, we could get practically equivalent posteriors for a finite and relatively small number of data points.

  • How fast posteriors converge to the same distribution depends on the data and the model. We can see that the posteriors arising from the black prior (Uniform) and gray prior (biased towards tails) converge faster to almost the same distribution, while it takes longer for the dark gray posterior (the one arising from the concentrated prior). Even after 150 trials, it is somehow easy to recognize the dark gray posterior as a different distribution from the two others.

  • Something not obvious from the figure is that we will get the same result if we update the posterior sequentially as if we do it all at once. We can compute the posterior 150 times, each time adding one more observation and using the obtained posterior as the new prior, or we can just compute one posterior for the 150 tosses at once. The result will be exactly the same. This feature not only makes perfect sense, but it also leads to a natural way of updating our estimations when we get new data, a situation common in many data-analysis problems.

1.7.5 The influence of the prior

From the preceding example, it is clear that priors can influence inferences. That’s fine – priors are supposed to do that. Maybe it would be better to not have priors at all. That would make modeling easier, right? Well, not necessarily. If you are not setting the prior, someone else will be doing it for you. Sometimes this is fine – default priors can be useful and have their place – but sometimes it is better to have more control. Let me explain.

We can think that every (statistical) model, Bayesian or not, has some kind of prior, even if the prior is not set explicitly. For instance, many procedures typically used in frequentist statistics can be seen as special cases of a Bayesian model under certain conditions, such as flat priors. One common way to estimate parameters is known as maximum likelihood; this method avoids setting a prior and works just by finding the single value maximizing the likelihood. This value is usually notated by adding a little hat on top of the name of the parameter we are estimating, such as . Contrary to the posterior estimate, which is a distribution, is a point estimate, a number. For the coin-flipping problem, we can compute it analytically:

 y ˆθ = -- N

If you go back to Figure 1.12, you will be able to check for yourself that the mode of the black posterior (the one corresponding to the uniform/flat prior) agrees with the values of , computed for each subplot. This is not a coincidence; it is a consequence of the fact that setting a Uniform prior and then taking the mode of the posterior is equivalent to maximum likelihood.

We cannot avoid priors, but if we include them in our analysis, we can get some potential benefits. The most direct benefit is that we get a posterior distribution, which is a distribution of plausible values and not only the most probable ones. Having a distribution can be more informative than a single-point estimate, as we saw the width of the distribution is related to the uncertainty we have for the estimate. Another benefit is that computing the posteriors means to average over the prior. This can lead to models that are more difficult to overfit and more robust predictions [Wilson and Izmailov2022].

Priors can bring us other benefits. Starting in the next chapter, we are going to use numerical methods to get posteriors. These methods feel like magic, until they don’t. The folk theorem of statistical computing states, ”When you have computational problems, often there’s a problem with your model” [Gelman2008]. Sometimes a wise choice of prior can make inference easier or faster. It is important to remark that we are not advocating for setting priors specifically to make inference faster, but it is often the case that by thinking about priors, we can get faster models.

One advantage of priors, one that is sometimes overlooked, is that having to think about priors can force us to think a little bit deeper about the problem we are trying to solve and the data we have. Sometimes the modeling process leads to a better understanding by itself irrespective of how well we end and fit the data or make predictions. By being explicit about priors, we get more transparent models, meaning they’re easier to criticize, debug (in a broad sense of the word), explain to others, and hopefully improve.

1.8 How to choose priors

Newcomers to Bayesian analysis (as well as detractors of this paradigm) are generally a little nervous about how to choose priors. Usually, they are afraid that the prior distribution will not let the data speak for itself! That’s OK, but we have to remember that data does not speak; at best, data murmurs. We can only make sense of data in the context of our models, including mathematical and mental models. There are plenty of examples in the history of science where the same data led people to think differently about the same topics, and this can happen even if you base your opinions on formal models.

Some people like the idea of using non-informative priors (also known as flat, vague, or diffuse priors). These priors have the least possible amount of impact on the analysis. While it is possible to use them for some problems deriving truly non-informative priors can be hard or just impossible. Additionally, we generally can do better as we usually have some prior information.

Throughout this book, we will follow the recommendations of Gelman, McElreath, Kruschke, and many others, and we will prefer weakly informative priors. For many problems, we often know something about the values a parameter can take. We may know that a parameter is restricted to being positive, or we may know the approximate range it can take, or whether we expect the value to be close to zero or below/above some value. In such cases, we can use priors to put some weak information in our models without being afraid of being too pushy. Because these priors work to keep the posterior distribution within certain reasonable bounds, they are also known as regularizing priors.

Informative priors are very strong priors that convey a lot of information. Using them is also a valid option. Depending on your problem, it could be easy or not to find good-quality information from your domain knowledge and turn it into priors. I used to work on structural bioinformatics. In this field, people have been using, in Bayesian and non-Bayesian ways, all the prior information they could get to study and predict the structure of proteins. This is reasonable because we have been collecting data from thousands of carefully designed experiments for decades and hence we have a great amount of trustworthy prior information at our disposal. Not using it would be absurd! There is nothing “objective” or “scientific” about throwing away valuable information. If you have reliable prior information, you should use it. Imagine if every time an automotive engineer had to design a new car, they had to start from scratch and reinvent the combustion engine, the wheel, and for that matter, the whole concept of a car.

PreliZ is a very new Python library for prior elicitation [Mikkola et al.2023Icazatti et al.2023]. Its mission is to help you to elicit, represent, and visualize your prior knowledge. For instance, we can ask PreliZ to compute the parameters of a distribution satisfying a set of constraints. Let’s say we want to find the Beta distribution with 90% of the mass between 0.1 and 0.7, then we can write:

Code 1.7

dist = pz.Beta() 
pz.maxent(dist, 0.1, 0.7, 0.9)

The result is a Beta distribution with parameters α = 2.5 and β = 3.6 (rounded to the first decimal point). The pz.maxent function computes the maximum entropy distribution given the constraints we specified. Why maximum entropy distribution? Because that is equivalent to computing the least informative distribution under those constraints. By default, PreliZ will plot the distribution as shown here:

PIC

Figure 1.13: Maximum entropy Beta distribution with 90% of the mass between 0.1 and 0.7

As eliciting prior has many facets, PreliZ offers many other ways to elicit priors. If you are interested in learning more about PreliZ, you can check the documentation at https://preliz.readthedocs.io.

Building models is an iterative process; sometimes the iteration takes a few minutes, and sometimes it could take years. Reproducibility matters and transparent assumptions in a model contribute to it. We are free to use more than one prior (or likelihood) for a given analysis if we are not sure about any special one; exploring the effect of different priors can also bring valuable information to the table. Part of the modeling process is about questioning assumptions, and priors (and likelihoods) are just that. Different assumptions will lead to different models and probably different results. By using data and our domain knowledge of the problem, we will be able to compare models and, if necessary, decide on a winner. Chapter 5 will be devoted to this issue. Since priors have a central role in Bayesian statistics, we will keep discussing them as we face new problems. So if you have doubts and feel a little bit confused about this discussion, just keep calm and don’t worry, people have been confused for decades and the discussion is still going on.

1.9 Communicating a Bayesian analysis

Creating reports and communicating results is central to the practice of statistics and data science. In this section, we will briefly discuss some of the peculiarities of this task when working with Bayesian models. In future chapters, we will keep looking at examples of this important matter.

1.9.1 Model notation and visualization

If you want to communicate the results of an analysis, you should also communicate the model you used. A common notation to succinctly represent probabilistic models is:

θ Beta(α,β)
y Bin(n = 1,p = θ)

This is just the model we use for the coin-flip example. As you may remember, the symbol indicates that the variable on the left of it is a random variable distributed according to the distribution on the right. In many contexts, this symbol is used to indicate that a variable takes approximately some value, but when talking about probabilistic models, we will read this symbol out loud, saying is distributed as. Thus, we can say θ is distributed as a Beta with parameters α and β, and y is distributed as a Binomial with parameters n = 1 and p = θ. The very same model can be represented graphically using Kruschke diagrams as in Figure 1.14.

PIC

Figure 1.14: A Kruschke diagram of a BetaBinomial model

On the first level, we have the prior that generates the values for θ, then the likelihood, and on the last line, the data, y. Arrows indicate the relationship between variables and the symbol indicates the stochastic nature of the variables. All Kruschke diagrams in the book were made using the templates provided by Rasmus Bååth ( http://www.sumsar.net/blog/2013/10/diy-kruschke-style-diagrams/).

1.9.2 Summarizing the posterior

The result of a Bayesian analysis is a posterior distribution, and all the information about the parameters (given a model and dataset) is contained in the posterior distribution. Thus, by summarizing the posterior, we are summarizing the logical consequences of a model and data. A common practice is to report, for each parameter, the mean (or mode or median) to have an idea of the location of the distribution and some measure of dispersion, such as the standard deviation, to have an idea of uncertainty in our estimates. The standard deviation works well for Normal-like distributions but can be misleading for other types of distributions, such as skewed ones.

A commonly used device to summarize the spread of a posterior distribution is to use a Highest-Density Interval (HDI). An HDI is the shortest interval containing a given portion of the probability density. If we say that the 95% HDI for some analysis is [2,5], we mean that according to our data and model, the parameter in question is between 2 and 5 with a probability of 0.95. There is nothing special about choosing 95%, 50%, or any other value. We are free to choose the 82% HDI interval if we like. Ideally, justifications should be context-dependent and not automatic, but it is okay to settle on some common value like 95%. As a friendly reminder of the arbitrary nature of this choice, the ArviZ default is 94%.

ArviZ is a Python package for exploratory analysis of Bayesian models, and it has many functions to help us summarize the posterior. One of those functions is az.plot_posterior, which we can use to generate a plot with the mean and HDI of θ. The distribution does not need to be a posterior distribution; any distribution will work. Figure 1.15 shows the result for a random sample from a Beta distribution:

Code 1.8

np.random.seed(1) 
az.plot_posterior({'θ':pz.Beta(4, 12).rvs(1000)})
PIC

Figure 1.15: A KDE of a sample from a Beta distribution with its mean and 94% HDI

Not Confidence Intervals

If you are familiar with the frequentist paradigm, please note that HDIs are not the same as confidence intervals. In the frequentist framework, parameters are fixed by design; a frequentist confidence interval either contains or does not contain the true value of a parameter. In the Bayesian framework, parameters are random variables, and thus we can talk about the probability of a parameter having specific values or being inside some interval. The unintuitive nature of confident intervals makes them easily misinterpreted and people often talk about frequentist confidence intervals as if they were Bayesian credible intervals.

1.10 Summary

We began our Bayesian journey with a very brief discussion of statistical modeling, probabilities, conditional probabilities, random variables, probability distributions and Bayes’ theorem. We then used the coin-flipping problem as an excuse to introduce basic aspects of Bayesian modeling and data analysis. We used this classic toy example to convey some of the most important ideas of Bayesian statistics, such as using probability distributions to build models and represent uncertainties. We tried to demystify the use of priors and put them on an equal footing with other elements that are part of the modeling process, such as the likelihood, or even more meta-questions, such as why we are trying to solve a particular problem in the first place.

We ended the chapter by discussing the interpretation and communication of the results of a Bayesian analysis. We assume there is a true distribution that in general is unknown (and in principle also unknowable), from which we get a finite sample, either by doing an experiment, a survey, an observation, or a simulation. To learn something from the true distribution, given that we have only observed a sample, we build a probabilistic model. A probabilistic model has two basic ingredients: a prior and a likelihood. Using the model and the sample, we perform Bayesian inference and obtain a posterior distribution; this distribution encapsulates all the information about a problem, given our model and data. From a Bayesian perspective, the posterior distribution is the main object of interest and everything else is derived from it, including predictions in the form of a posterior predictive distribution. As the posterior distribution (and any other derived quantity from it) is a consequence of the model and data, the usefulness of Bayesian inferences is restricted by the quality of models and data. Finally, we briefly summarized the main aspects of doing Bayesian data analysis. Throughout the rest of this book, we will revisit these ideas to absorb them and use them as the scaffold of more advanced concepts.

In the next chapter, we will introduce PyMC, which is a Python library for Bayesian modeling and probabilistic machine learning and will use more features from ArviZ, a Python library for the exploratory analysis of Bayesian models, and PreliZ a Python library for prior elicitation.

1.11 Exercises

We do not know whether the brain works in a Bayesian way, in an approximately Bayesian fashion, or maybe some evolutionary (more or less) optimized heuristics. Nevertheless, we know that we learn by exposing ourselves to data, examples, and exercises… Well you may say that humans never learn, given our record as a species on subjects such as wars or economic systems that prioritize profit and not people’s well-being... Anyway, I recommend you do the proposed exercises at the end of each chapter:

  1. Suppose you have a jar with 4 jelly beans: 2 are strawberry-flavored, 1 is blueberry-flavored, and 1 is cinnamon-flavored. You draw one jelly bean at random from the jar.

    1. What is the sample space for this experiment?

    2. We define event A as the jelly bean drawn is strawberry-flavored and event B as The jelly bean drawn is not cinnamon-flavored. What are the probabilities of events A and B?

    3. Are events A and B mutually exclusive? Why or why not?

  2. Previously, we defined a Python function P to compute the probability of an event using the naive definition of probability. Generalize that function to compute the probability of events when they are not all equally likely. Use this new function to compute the probability of events A and B from the previous exercise. Hint: you can pass a third argument with the probability of each event.

  3. Use PreliZ to explore different parameters for the BetaBinomial and Gaussian distributions. Use the methods plot_pdf, plot_cdf, and plot_interactive.

  4. We discussed the probability mass/density functions and the cumulative density function. But there are other ways to represent functions like the percentile point function ppf. Using the plot_ppf method of PreliZ, plot the percentile point function for the BetaBinomial and Gaussian distributions. Can you explain how the ppf is related to the cdf and pmf/pdf?

  5. From the following expressions, which one corresponds to: the probability of being sunny given that it is 9th of July of 1816?

    1. p(sunny)

    2. p(sunny|July)

    3. p(sunny|9 of July of 1816)

    4. p(9th of July of 1816|sunny)

    5. p(sunny,9th of July-of 1816) p(9th of July of 1816)

  6. We showed that the probability of choosing a human at random and picking the Pope is not the same as the probability of the Pope being human. In the animated series Futurama, the (Space) Pope is a reptile. How does this change your previous calculations?

  7. Following the example in Figure 1.9, use PreliZ to compute the moments for the SkewNormal distribution for a different combination of parameters. Generate random samples of different sizes, like 10, 100, and 1,000, and see if you can recover the values of the first two moments (mean and variance) from the samples. What do you observe?

  8. Repeat the previous exercise for the Student’s T distribution. Try values of ν like 2, 3, 500. What do you observe?

  9. In the following definition of a probabilistic model, identify the prior and the likelihood:

    Y ∼ Normal (μ,σ) μ ∼ Normal (0,2) σ ∼ HalfNormal (0.75 )
  10. In the previous model, how many parameters will the posterior have? Compare it with the model for the coin-flipping problem.

  11. Write Bayes’ theorem for the model in exercise 9.

  12. Let’s suppose that we have two coins; when we toss the first coin, half of the time it lands on tails and half of the time on heads. The other coin is a loaded coin that always lands on heads. If we take one of the coins at random and get a head, what is the probability that this coin is the unfair one?

  13. Try re-plotting Figure 1.12 using other priors (beta_params) and other data (trials and data).

  14. Read about the Cromwell rule on Wikipedia: https://en.wikipedia.org/wiki/Cromwell%27s_rule.

  15. Read about probabilities and the Dutch book on Wikipedia: https://en.wikipedia.org/wiki/Dutch_book.

Join our community Discord space

Join our Discord community to meet like-minded people and learn alongside more than 5000 members at: https://packt.link/bayesian

PIC

Left arrow icon Right arrow icon
Download code icon Download Code

Key benefits

  • Conduct Bayesian data analysis with step-by-step guidance
  • Gain insight into a modern, practical, and computational approach to Bayesian statistical modeling
  • Enhance your learning with best practices through sample problems and practice exercises
  • Purchase of the print or Kindle book includes a free PDF eBook.

Description

The third edition of Bayesian Analysis with Python serves as an introduction to the main concepts of applied Bayesian modeling using PyMC, a state-of-the-art probabilistic programming library, and other libraries that support and facilitate modeling like ArviZ, for exploratory analysis of Bayesian models; Bambi, for flexible and easy hierarchical linear modeling; PreliZ, for prior elicitation; PyMC-BART, for flexible non-parametric regression; and Kulprit, for variable selection. In this updated edition, a brief and conceptual introduction to probability theory enhances your learning journey by introducing new topics like Bayesian additive regression trees (BART), featuring updated examples. Refined explanations, informed by feedback and experience from previous editions, underscore the book's emphasis on Bayesian statistics. You will explore various models, including hierarchical models, generalized linear models for regression and classification, mixture models, Gaussian processes, and BART, using synthetic and real datasets. By the end of this book, you will possess a functional understanding of probabilistic modeling, enabling you to design and implement Bayesian models for your data science challenges. You'll be well-prepared to delve into more advanced material or specialized statistical modeling if the need arises.

What you will learn

Build probabilistic models using PyMC and Bambi Analyze and interpret probabilistic models with ArviZ Acquire the skills to sanity-check models and modify them if necessary Build better models with prior and posterior predictive checks Learn the advantages and caveats of hierarchical models Compare models and choose between alternative ones Interpret results and apply your knowledge to real-world problems Explore common models from a unified probabilistic perspective Apply the Bayesian framework's flexibility for probabilistic thinking

What do you get with eBook?

Product feature icon Instant access to your Digital eBook purchase
Product feature icon Download this book in EPUB and PDF formats
Product feature icon Access this title in our online reader with advanced features
Product feature icon DRM FREE - Read whenever, wherever and however you want
Buy Now

Product Details


Publication date : Jan 31, 2024
Length 394 pages
Edition : 3rd Edition
Language : English
ISBN-13 : 9781805127161
Category :
Languages :

Table of Contents

15 Chapters
Preface Chevron down icon Chevron up icon
Chapter 1 Thinking Probabilistically Chevron down icon Chevron up icon
Chapter 2 Programming Probabilistically Chevron down icon Chevron up icon
Chapter 3 Hierarchical Models Chevron down icon Chevron up icon
Chapter 4 Modeling with Lines Chevron down icon Chevron up icon
Chapter 5 Comparing Models Chevron down icon Chevron up icon
Chapter 6 Modeling with Bambi Chevron down icon Chevron up icon
Chapter 7 Mixture Models Chevron down icon Chevron up icon
Chapter 8 Gaussian Processes Chevron down icon Chevron up icon
Chapter 9 Bayesian Additive Regression Trees Chevron down icon Chevron up icon
Chapter 10 Inference Engines Chevron down icon Chevron up icon
Chapter 11 Where to Go Next Chevron down icon Chevron up icon
Bibliography Chevron down icon Chevron up icon
Other Books You May Enjoy Chevron down icon Chevron up icon
Index Chevron down icon Chevron up icon

Customer reviews

Filter icon Filter
Top Reviews
Rating distribution
Empty star icon Empty star icon Empty star icon Empty star icon Empty star icon 0
(0 Ratings)
5 star 0%
4 star 0%
3 star 0%
2 star 0%
1 star 0%

Filter reviews by


No reviews found
Get free access to Packt library with over 7500+ books and video courses for 7 days!
Start Free Trial

FAQs

How do I buy and download an eBook? Chevron down icon Chevron up icon

Where there is an eBook version of a title available, you can buy it from the book details for that title. Add either the standalone eBook or the eBook and print book bundle to your shopping cart. Your eBook will show in your cart as a product on its own. After completing checkout and payment in the normal way, you will receive your receipt on the screen containing a link to a personalised PDF download file. This link will remain active for 30 days. You can download backup copies of the file by logging in to your account at any time.

If you already have Adobe reader installed, then clicking on the link will download and open the PDF file directly. If you don't, then save the PDF file on your machine and download the Reader to view it.

Please Note: Packt eBooks are non-returnable and non-refundable.

Packt eBook and Licensing When you buy an eBook from Packt Publishing, completing your purchase means you accept the terms of our licence agreement. Please read the full text of the agreement. In it we have tried to balance the need for the ebook to be usable for you the reader with our needs to protect the rights of us as Publishers and of our authors. In summary, the agreement says:

  • You may make copies of your eBook for your own use onto any machine
  • You may not pass copies of the eBook on to anyone else
How can I make a purchase on your website? Chevron down icon Chevron up icon

If you want to purchase a video course, eBook or Bundle (Print+eBook) please follow below steps:

  1. Register on our website using your email address and the password.
  2. Search for the title by name or ISBN using the search option.
  3. Select the title you want to purchase.
  4. Choose the format you wish to purchase the title in; if you order the Print Book, you get a free eBook copy of the same title. 
  5. Proceed with the checkout process (payment to be made using Credit Card, Debit Cart, or PayPal)
Where can I access support around an eBook? Chevron down icon Chevron up icon
  • If you experience a problem with using or installing Adobe Reader, the contact Adobe directly.
  • To view the errata for the book, see www.packtpub.com/support and view the pages for the title you have.
  • To view your account details or to download a new copy of the book go to www.packtpub.com/account
  • To contact us directly if a problem is not resolved, use www.packtpub.com/contact-us
What eBook formats do Packt support? Chevron down icon Chevron up icon

Our eBooks are currently available in a variety of formats such as PDF and ePubs. In the future, this may well change with trends and development in technology, but please note that our PDFs are not Adobe eBook Reader format, which has greater restrictions on security.

You will need to use Adobe Reader v9 or later in order to read Packt's PDF eBooks.

What are the benefits of eBooks? Chevron down icon Chevron up icon
  • You can get the information you need immediately
  • You can easily take them with you on a laptop
  • You can download them an unlimited number of times
  • You can print them out
  • They are copy-paste enabled
  • They are searchable
  • There is no password protection
  • They are lower price than print
  • They save resources and space
What is an eBook? Chevron down icon Chevron up icon

Packt eBooks are a complete electronic version of the print edition, available in PDF and ePub formats. Every piece of content down to the page numbering is the same. Because we save the costs of printing and shipping the book to you, we are able to offer eBooks at a lower cost than print editions.

When you have purchased an eBook, simply login to your account and click on the link in Your Download Area. We recommend you saving the file to your hard drive before opening it.

For optimal viewing of our eBooks, we recommend you download and install the free Adobe Reader version 9.