Search icon
Subscription
0
Cart icon
Close icon
You have no products in your basket yet
Arrow left icon
All Products
Best Sellers
New Releases
Books
Videos
Audiobooks
Learning Hub
Newsletters
Free Learning
Arrow right icon
Matplotlib 3.0 Cookbook

You're reading from  Matplotlib 3.0 Cookbook

Product type Book
Published in Oct 2018
Publisher Packt
ISBN-13 9781789135718
Pages 676 pages
Edition 1st Edition
Languages
Authors (2):
Srinivasa Rao Poladi Srinivasa Rao Poladi
Profile icon Srinivasa Rao Poladi
Nikhil Borkar Nikhil Borkar
Profile icon Nikhil Borkar
View More author details

Table of Contents (17) Chapters

Preface 1. Anatomy of Matplotlib 2. Getting Started with Basic Plots 3. Plotting Multiple Charts, Subplots, and Figures 4. Developing Visualizations for Publishing Quality 5. Plotting with Object-Oriented API 6. Plotting with Advanced Features 7. Embedding Text and Expressions 8. Saving the Figure in Different Formats 9. Developing Interactive Plots 10. Embedding Plots in a Graphical User Interface 11. Plotting 3D Graphs Using the mplot3d Toolkit 12. Using the axisartist Toolkit 13. Using the axes_grid1 Toolkit 14. Plotting Geographical Maps Using Cartopy Toolkit 15. Exploratory Data Analysis Using the Seaborn Toolkit 16. Other Books You May Enjoy

Working in non-interactive mode

In the interactive mode, we have seen the graph getting built step by step with each instruction. In non-interactive mode, you give all instructions to build the graph and then display the graph with a command explicitly.

How to do it...

Working on non-interactive mode won't be difficult either:

  1. Start the kernel afresh, and import the matplotlib and pyplot libraries:
import matplotlib
import matplotlib.pyplot as plt
  1. Set the interactive mode to OFF:
plt.ioff()
  1. Check the status of interactive mode:
matplotlib.is_interactive()

  1. You should get the output False.
  2. Execute the following code; you will not see the plot on your screen:
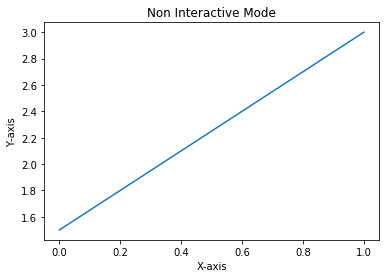
# Plot a line graph
plt.plot([1.5, 3.0])

# Plot the title, X and Y axis labels
plt.title("Non Interactive Mode")
plt.xlabel("X-axis")
plt.ylabel("Y-axis")
  1. Execute the following statement, and then you will see the plot on your screen:
# Display the graph on the screen 
plt.show()

How it works...

Each of the preceding code statements is self-explanatory. The important thing to note is in non-interactive mode, you write complete code for the graph you want to display, and call plt.show() explicitly to display the graph on the screen.

The following is the output obtained:

The latest versions of Jupyter Notebook seem to display the figure without calling plt.show() command explicitly. However, in Python shell or embedded applications, plt.show() or plt.draw() is required to display the figure on the screen.
You have been reading a chapter from
Matplotlib 3.0 Cookbook
Published in: Oct 2018 Publisher: Packt ISBN-13: 9781789135718
Register for a free Packt account to unlock a world of extra content!
A free Packt account unlocks extra newsletters, articles, discounted offers, and much more. Start advancing your knowledge today.
Unlock this book and the full library FREE for 7 days
Get unlimited access to 7000+ expert-authored eBooks and videos courses covering every tech area you can think of
Renews at €14.99/month. Cancel anytime}