


PARALLEL SLANTED LINES IN MATPLOTLIB
If two lines in the Euclidean plane have the same slope, then they are parallel. Listing 5.7 displays the content of parallellines1.py that illustrates how to plot parallel slanted lines.
LISTING 5.7: parallellines1.py
import matplotlib.pyplot as plt
import numpy as np

# lower line
x1 = np.linspace(-5,5,num=200)
y1 = 2*x1

# upper line
x2 = np.linspace(-5,5,num=200)
y2 = 2*x2 + 3

# horizontal axis
x3 = np.linspace(-5,5,num=200)
y3 = 0*x3 + 0

# vertical axis
plt.axvline(x=0.0)

plt.axis([-5, 5, -10, 10])
plt.plot(x1,y1)
plt.plot(x2,y2)
plt.plot(x3,y3)
plt.show()
Listing 5.7 defines three lines using the technique that you saw in Listing 5.6, where two lines are slanted and parallel, and the third line is horizontal. Launch the code in Listing 5.7, and you will see the result displayed in Figure 5.4.
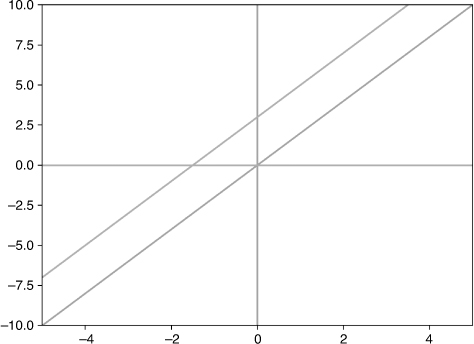
FIGURE 5.4 A graph of two slanted parallel line segments


