


As you can see in the menu drop-down, there are multiple sheet object types to choose from, such as List Box, Statistics Box, Chart, Input Box, Current Selections Box, Multi Box, Table Box, Button, Text Object, Line/Arrow Object, Slider/Calendar Object, and Bookmark Object. We will cover more of them in the course of this book. Help and Extended Examples on the QlikView website will allow you to explore ideas beyond the scope of this book.
We chose the Statistic Box Sheet object to add the grand total to our analysis. From this, we can see that the total company is out of balance by $1.59. From an auditor's point of view, this amount is probably small enough to be immaterial, but, from our point of view as financial professionals, we want to know where our books are not in balance.
To make our investigation easier, we will add one additional sheet object—List Box—for Company. Right-click and, from the Context menu, choose New Sheet Object; then choose List Box. We will now go through each tab of the List Box properties.
On the General tab of List Box, we will give the new List Box the Title of Company List. The object ID will be system-generated. We choose the Field Company from the fields available in the data file that we loaded. We can check the box to show Frequency in Percent below Title and Field, which will only tell us how many account lines in October were loaded for each company.
In the Expressions tab, we can add formulas to analyze the data. Here, we will click on ADD and will choose SUM; since we only have numerical data in the Amount field, we will sum Amount. Don't forget to click on the PASTE button to move your expression into Expression Checker. Expression Checker will tell you whether the expression format is OK or whether there is a syntax problem.
Note
If you forget to move your expression into Expression Checker with the PASTE button, the expression will not be saved and will not appear in your application.
The Sort tab allows you to change the Sort criteria from text to numeric or even date. We will not change the Sort for Company.
The Presentation tab allows you to adjust things such as column or row header wrap, cell borders, and background pictures.
The Number tab allows you to override the default format to tell the sheet whether you want to format the data as money, a percentage, or dates, for example. But in this version, it does not seem to be working properly until selected. We can use this tab on our table box that is currently labeled Sum(Amount) to format Amount as money after we have finished creating our new company List Box.
The Font tab lets you choose the display font you want to use, the display size, and whether to make your font bold.
Layout allows you to establish and apply themes and format the appearance of the sheet object, which, in this case, is List Box.
The Caption tab further formats the sheet object and allows us, in the case of List Box, to choose the icons that will appear in the top bar of the List Box so that we can use those icons to Select and Clear selections in the List Box. In this example, we have selected Search, Select All, and Clear. The following screenshot shows this:
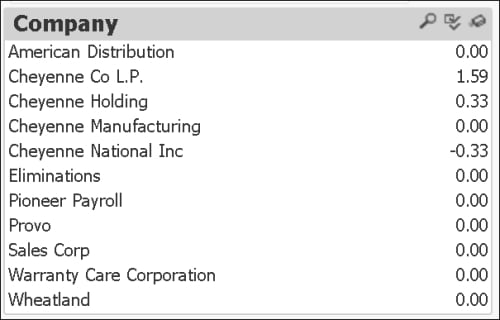
Figure 1-3: Added company list box
We can now see that we are actually out of balance in three companies. Cheyenne Co L.P. is the company that is out of balance by $1.59, but Cheyenne Holding and Cheyenne National Inc seem to have balancing entries that balance at the total companies level but don't balance at the individual company level.
Now we need to edit our Table Box sheet object with the Amount displayed. Right-click on the Straight Table sheet object and choose Properties from the pop-up menu. In the first tab, the General tab, give Table a suitable name if desired. Then move over to the Number tab and choose Money for the number format. Click on APPLY to immediately apply the number format, and click on OK to close the wizard.
Now our Straight Table sheet object looks like the previous screenshot displaying dollar signs and two decimals for Amount.
We can analyze our data just using the list boxes by selecting Company, seeing which Account Groups are included, and seeing which Cost Centers are included (white) and which are excluded (gray). Our selected company shows up in green and in Current Selection Box.
By selecting Cheyenne Holding, we can see that it is indeed a holding company and doesn't have any manufacturing or sales accounting groups or cost centers. Also, that particular company is in balance.


