Reader small image

You're reading from  Extending Power BI with Python and R - Second Edition

Product typeBook
Published inMar 2024
Reading LevelIntermediate
PublisherPackt
ISBN-139781837639533
Edition2nd Edition
Languages
Right arrow
Author (1)
Luca Zavarella
Luca Zavarella
author image
Luca Zavarella

Luca Zavarella has a rich background as an Azure Data Scientist Associate and Microsoft MVP, with a Computer Engineering degree from the University of L'Aquila. His decade-plus experience spans the Microsoft Data Platform, starting as a T-SQL developer on SQL Server 2000 and 2005, then mastering the full suite of Microsoft Business Intelligence tools (SSIS, SSAS, SSRS), and advancing into data warehousing. Recently, his focus has shifted to advanced analytics, data science, and AI, contributing to the community as a speaker and blogger, especially on Medium. Currently, he leads the Data & AI division at iCubed, and he also holds an honors degree in classical piano from the "Alfredo Casella" Conservatory in L'Aquila.
Read more about Luca Zavarella

Right arrow

Configuring Power BI Desktop to work with Python

Since you have everything you need installed, you can now configure Power BI Desktop to interact with Python engines and IDEs. This is really a very simple task:

  1. In Power BI Desktop, go to the File menu, click on the Options and settings tab, and then click on Options.
  2. In the Options window, click on the Python scripting link on the left. The contents of the panel on the right will update, giving you the option to select the Python environment to reference and the Python IDE to use for Python visuals. In order to select a specific environment, you need to choose Other and then click Browse and supply a reference to your environment folder:
Figure 3.36 – Configuring your Python environment and IDE in Power BI

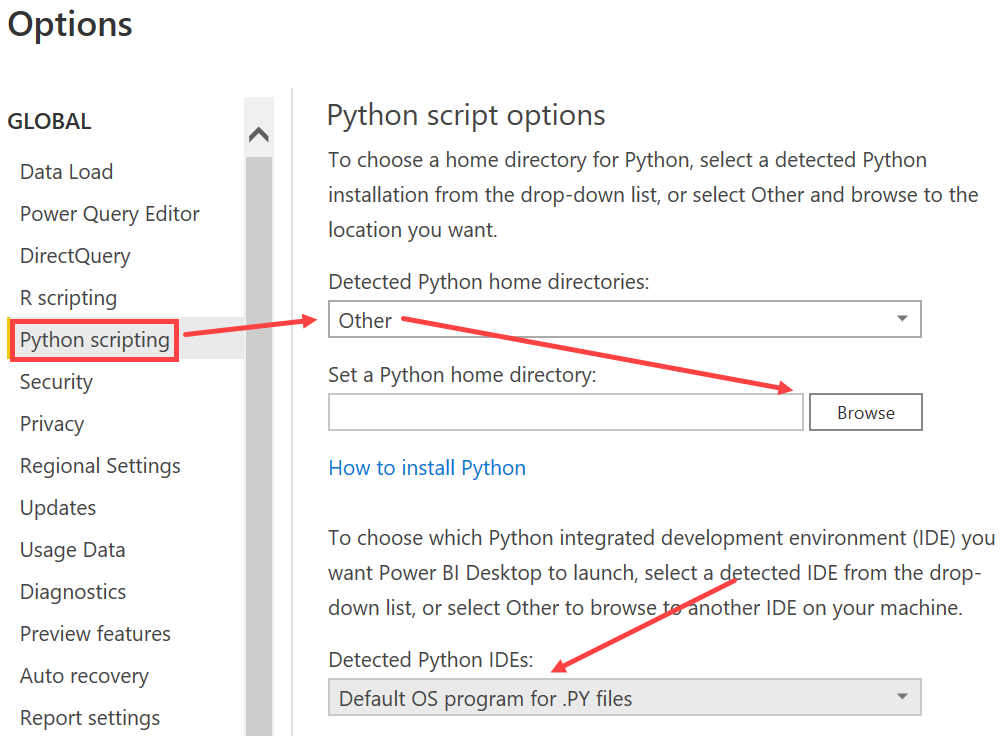
Usually, you can find the default environments folder in C:\ProgramData\Miniconda3\envs\ (all user installation) or C:\Users\<username>\miniconda3\envs\ (just your user installation). If you cannot see the hidden ProgramData...

Limitations of Python visuals

Python visuals have some important limitations regarding the data they can handle, both input and output:

  • A Python visual can handle a dataframe with only 150,000 rows. If there are more than 150,000 rows, only the first 150,000 rows are used.
  • Python visuals have an output size limit of 2 MB.

You must also be careful not to exceed the 5-minute runtime calculation for a Python visual in order to avoid a time-out error. Moreover, in order not to run into performance problems, the resolution of the Python visual plots is fixed at 72 DPI.As you can imagine, some limitations of Python script visuals are different depending on whether you run the visual on Power BI Desktop or the Power BI service.If you think you need to develop reports intended only for the Power BI Desktop, without the need to publish them on the service, you can do any of the following:

  • Install any kind of package (Conda, PyPI and custom) in your engine for Python visuals.
  • Access the internet...

Summary

In this chapter, you learned about the most popular free Python distributions in the community and the best practices for their use.Using the unique features of Power BI Desktop and the Power BI service, you have learned how to properly create specific Python environments.You also learned that the most popular IDE in the R community (RStudio) can also run Python code. In addition, you have installed and configured VSCode, which is to date one of the most widely used advanced editors for Python.You were also introduced to all of the best practices for properly configuring both Power BI Desktop and the Power BI service with Python, whether in a development or enterprise environment.Finally, you've learned some of the limitations on using Python with Power BI, knowledge of which is critical to avoid making mistakes in developing and deploying reports.In the next chapter, we will show you the most common problems you might run into when using Python and R script steps in Power...

Test your knowledge

Keep in mind that many of the questions asked in Chapter 2 about R also apply to Python. It is therefore recommended that you answer those as well, if you have not already done so.Q01. Which Python distributions are most widely used by data scientists?Q02. What are the most commonly used tools for installing packages in Python? What are their most important differences?Q03. How many instances of the engine should be installed to ensure reproducibility of results for Python scripts in Power Query and Python script visuals?Q04. A colleague of yours has prepared a virtual environment dedicated to Python script visuals, containing the latest Python release allowed by Miniconda. Did he follow the best practices stated in this chapter?Q05. Suppose you created a report with a Python script visual that highlights insights from a dataset created by uploading data from an HTML table available on the Web. What do you need to allow a refresh of the data once the report is published...

Using multiple datasets in Python and R script steps

You may have noticed how each query in Power Query has its own queue of transformation steps, leading from the initial data to the final dataset in the desired form. You may need to add a Python or R script step that uses a function to which you need to pass two dataframes as parameters to a query.

Assuming I have the two queries, query_A and query_B, which return the two datasets to be used as parameters for the above function, how do I reference the result of query_B in my script if I’m adding the script step to query_A?

There are several ways to do this. Let’s see them.

Applying a full join with Merge

The first trick that comes to mind for any analyst who is used to dealing with data is to apply a full join between the two datasets and thus generate a third dataset on which to apply the script step. Within the script step, the reverse merge transformation is applied, that is, separating the columns...

Dealing with dates/times in Python and R script steps

The handling of date, date/time, and time fields is native in Power BI. If you want to add a Python or R script step from a dataset containing a date/time field, you would expect to find that field in the default dataset dataframe with the corresponding data type depending on whether it is a Python or R script. Unfortunately, it is not so straightforward. But with a little forethought, it is possible to handle these data types in the right way.

The code used in both Python and R makes use of date-specific functions with which you may not be too familiar. It is not important to completely know them for the purposes of understanding the section; you can delve into them later when you need to.

In the folder pertaining to Chapter 4 in the GitHub repository associated with the book, you will find the date-time-fields.xlsx Excel file containing the dates sheet with only date, date/time, and time fields:

Text, table  Description automatically generated

Figure 4.49:...

Summary

In this chapter, you covered some of the types of issues that are common when integrating Python or R scripts into Power BI.

In particular, you learned how to avoid the indecipherable ADO.NET error that can occur when you use Power BI with a conda environment that is not properly enabled. You learned about the different levels of privacy that are managed in Power BI and how to resolve incompatibility issues between them that are caused by the Formula Firewall. You also learned new techniques for referencing more than one dataset in a Python or R script, even though the step stack in which the script is inserted references only one dataset. Finally, you learned how to properly handle data types for date and time fields in step scripts in Python and R.

In the next chapter, you’ll start working with Python and R scripts in Power BI to perform data ingestion and import data sources that Power BI doesn’t handle by default.

Test your knowledge

  1. Why does Power BI Desktop sometimes raise the ADO.NET error referring to the inability to import the NumPy library, even though the package is correctly installed in the conda environment referenced in the Options?
  2. What’s the goal of the Data Privacy Firewall, aka the Firewall?
  3. List the two types of errors that the Firewall can raise and describe their characteristics.
  4. Suppose you need an on-premises data gateway in enterprise mode to allow some datasets to be refreshed after publishing your report to the Power BI service. Will the published datasets have privacy levels aligned with those set on Power BI Desktop?
  5. Suppose you have a query that directly accesses a data source and involves a Python script step. The query has a privacy level set to Organizational, whereas the Python script has the privacy level set to Public. Does the firewall raise errors? If yes, which ones?
  6. What are the pros and cons of the two methods...
lock icon
The rest of the chapter is locked
You have been reading a chapter from
Extending Power BI with Python and R - Second Edition
Published in: Mar 2024Publisher: PacktISBN-13: 9781837639533
Register for a free Packt account to unlock a world of extra content!
A free Packt account unlocks extra newsletters, articles, discounted offers, and much more. Start advancing your knowledge today.
undefined
Unlock this book and the full library FREE for 7 days
Get unlimited access to 7000+ expert-authored eBooks and videos courses covering every tech area you can think of
Renews at €14.99/month. Cancel anytime

Author (1)

author image
Luca Zavarella

Luca Zavarella has a rich background as an Azure Data Scientist Associate and Microsoft MVP, with a Computer Engineering degree from the University of L'Aquila. His decade-plus experience spans the Microsoft Data Platform, starting as a T-SQL developer on SQL Server 2000 and 2005, then mastering the full suite of Microsoft Business Intelligence tools (SSIS, SSAS, SSRS), and advancing into data warehousing. Recently, his focus has shifted to advanced analytics, data science, and AI, contributing to the community as a speaker and blogger, especially on Medium. Currently, he leads the Data & AI division at iCubed, and he also holds an honors degree in classical piano from the "Alfredo Casella" Conservatory in L'Aquila.
Read more about Luca Zavarella