
In this chapter, we will cover the following recipes:
- Loading data from the UCI repository
- Viewing the Pima Indians diabetes dataset with pandas
- Looking at the UCI Pima Indians dataset web page
- Machine learning with logistic regression
- Examining logistic regression errors with a confusion matrix
- Varying the classification threshold in logistic regression
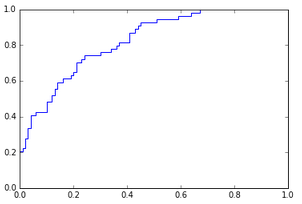
- Receiver operating characteristic – ROC analysis
- Plotting an ROC curve without context
- Putting it all together – UCI breast cancer dataset