


THE MSE (MEAN SQUARED ERROR) FORMULA
Figure 2.8 displays the formula for the MSE. Translated into English: the MSE is the sum of the squares of the difference between an actual y value and the predicted y value, divided by the number of points. Note that the predicted y value is the y value that each data point would have if that data point were actually on the best-fitting line.
In general, the goal is to minimize the error, which determines the best fitting line in the case of linear regression. However, you might be satisfied with a “good enough” value when the time and/or cost for any additional reduction in the error is deemed prohibitive, which means that this decision is not a purely programmatic decision.
Figure 2.8 displays the formula for MSE for calculating the best-fitting line for a set of points in the plane.
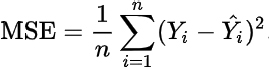
FIGURE 2.8 The MSE formula.
Other Error Types
Although we will only discuss MSE for linear regression in this book, there are other types of formulas...


