


TRIGONOMETRIC FUNCTIONS IN MATPLOTLIB
You can display the graph of trigonometric functions as easily as you can render “regular” graphs using Matplotlib. Listing 5.16 displays the content of sincos.py that illustrates how to plot a sine function and a cosine function in Matplotlib.
LISTING 5.16: sincos.py
import numpy as np
import math

x = np.linspace(0, 2*math.pi, 101)
s = np.sin(x)
c = np.cos(x)

import matplotlib.pyplot as plt
plt.plot (s)
plt.plot (c)
plt.show()
Listing 5.16 defines the NumPy variables x, s, and c using the NumPy APIs linspace(), sin(), and cos(), respectively. Next, the Pyplot API plot() uses these variables to display a sine function and a cosine function.
Figure 5.13 displays a graph of two trigonometric functions based on the code in Listing 5.16.
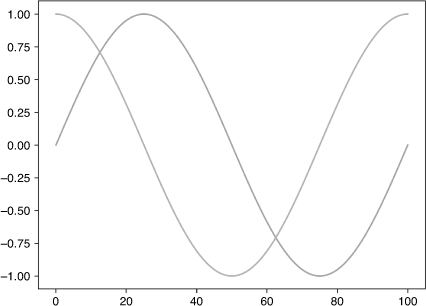
FIGURE 5.13 Sine and cosine trigonometric functions
Now let’s look at a simple dataset consisting of discrete data points, which is the topic of the next section.


