Up until now, our focus has been more on loading data into QlikView and building the data model than on actually visualizing the information. It's about time we started working on the frontend of our document and present the data in the form of a dashboard.
Besides presenting useful insights, a very important aspect of a business dashboard is that it should be visually appealing. Our users will be accessing the document every day, so we had better give them something nice to look at while they are drinking their morning coffee.
Our course of action for now will be to take advantage of QlikView's customization flexibility to style up our document, brand it with HighCloud's corporate identity, and set up the general layout on which we will ultimately place our charts.
In this chapter, we will cover the following topics:
Setting up the workspace
Understanding and changing the sheet's properties
Managing our sheet object's appearance
Using some of the most fundamental objects...
When we start building the frontend of a QlikView document, we should always begin by defining two fundamental characteristics:
We need to set a standard screen resolution right from the start because it will ultimately determine the placement and size of the objects across the screen. If we build the document targeting a screen resolution higher than that which users have on their machines, they will probably need to use the scroll bars too often. On the other hand, if we target our document to a screen resolution lower than our users' screen resolution, they will see a lot of empty space. Both of these situations will be an inconvenience that our users will need to deal with every day, so we don't want that to happen.
Note
Having a predefined resolution in the document does not keep the user from accessing a document using a lower (or higher)resolution monitor...
The Document Properties window
The
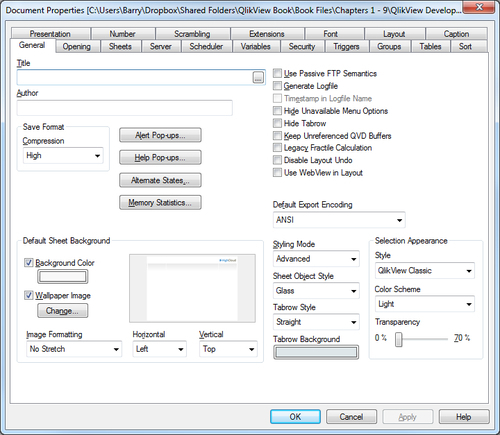
Document Properties window is where document-level settings are defined. Using this dialog window, we will ensure that HighCloud's logo is embedded into every worksheet of the document. We will also divide the screen space into the panels described previously and set the default Background Color option to white. The Document Properties window is shown in the following screenshot:
With these design requirements in mind, we will start setting up the document's appearance by following these steps:
Open the Airline Operations.qvw document we've been working with and go to the Dashboard tab.
As the document needs to fit the default corporate resolution of 1280 x 1024, select View | Resize Window | 1280 x 1024 from the menu bar.
Then, open the Document Properties window by pressing Ctrl + Alt + D or by selecting Settings | Document Properties from the menu bar.
Navigate to the General tab and enable the Wallpaper Image checkbox. Then, click on the Change… button...
The Sheet Properties dialog
Just as there are document-level properties, we can also set properties at the sheet- and object-level. Let's have a quick look at the
Sheet Properties dialog.
Open this window by right-clicking on an empty space in the Dashboard worksheet and selecting Properties….
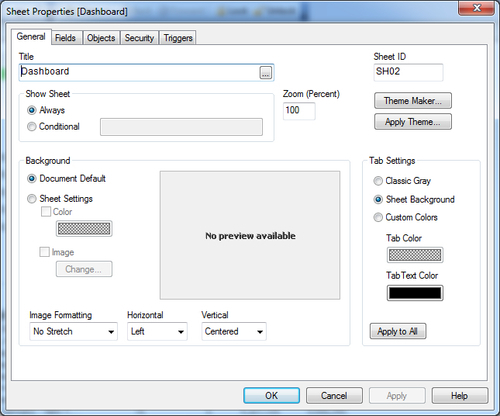
The following screenshot shows the Sheet Properties dialog:
As its name implies, the Sheet Properties dialog can be used to set various properties of a worksheet. Let's quickly review the available options.
On the
General tab, the following properties are of interest:
Title: This property can be
used to set the title that appears in the tab row. In addition to static text, this can also be a calculated value.
Show Sheet: This
property can be used to conditionally hide/show the sheet. For example, we can use an expression like GetSelectedCount([Carrier Name]) = 1 to only show the sheet when a single carrier is selected.
Sheet ID: This property is the
internal ID of the sheet. This ID can be used to...
Setting the object properties
It's now time to peek into some of the object-level properties that affect the QlikView document's appearance. The properties we are most interested in at this point are:
Caption colors
Caption font
Let's see what these are.
By default, almost every object in the QlikView document has a caption bar at the top, unless we choose to explicitly hide it. Since the caption bar will be visible for most of our objects, let's apply a touch of corporate identity by setting the default caption color to HighCloud Blue and by selecting a custom styling mode.
Changing the caption colors
Follow these steps to apply a new formatting style to caption bars:
Right-click on any of the listboxes on the sheet, for example, Carrier's Operating Region.
Select Properties… and navigate to the Caption tab.
Two types of caption colors can be set: one for when the object is Inactive and one for when the object is Active. An active object is the one on which the user has last...
Currently, our QlikView document contains the following listboxes in the Dashboard sheet:
Let's see how we can add listboxes and change their properties.
Lets add another listbox representing the Carrier Name field by right-clicking on the worksheet and selecting Properties… (or by pressing Ctrl + Alt + S, which is the shortcut for the Settings | Sheet Properties menu command). Next, open the Fields tab, locate the Carrier Name field under the Available Fields list, and click on Add > to add it as a new listbox.
Tip
Many routes lead to Rome
To add an object to a worksheet, there are three basic methods: using the menu, using the toolbar, or using the pop-up menu:
Menu: By selecting Layout | New Sheet Object
Toolbar: By using the design toolbar
Pop-up: By right-clicking on a blank space within the worksheet and choosing the desired object from the New Sheet...
While listboxes are a very convenient way to quickly make selections, the downside is that they can also take up a lot of space. This is where the multi box offers an alternative. The multi box displays each field on a single line, alongside a drop-down that expands to allow selections to be made.
Let's add a multi box that contains some extra information on flights, by following these steps:
Select Layout | New Sheet Object | Multi Box….
In the Title input field enter Flight Information.
From the list of Available Fields, double-click the fields From – To City, Origin City, Origin Country, Destination City, Destination Country, and Distance Interval.
Go to the Sort tab and select Distance Interval from the list of Fields.
In the Sort by section, uncheck the Text option, and mark the Load Order checkbox.
Click on OK to apply the settings and close the Multi Box Properties page.
The resulting multi box should look like the one shown in the following screenshot. Notice how the list of...
The Current Selections Box
QlikView lets us select data in many different ways: listboxes, clicking in charts and entering search terms, just to name a few. While this is incredibly flexible, it can also become hard to see which information is actually selected at any given moment.
Fortunately, QlikView has an option to show the user exactly which selections are currently applied to the data: the Current Selections dialog. To open this dialog, we simply need to press Ctrl + Q or select View | Current Selections from the menu bar. This floats the Current Selections dialog window on top of our worksheet. Once we have had a glance at the Current Selections window, we can close the dialog.
It is sometimes useful to permanently display the Current Selections dialog. This is where the Current Selections Box object comes in handy. To add a Current Selections Box object to our Dashboard sheet, follow these steps:
Select Layout | New Sheet Object | Current Selections Box.
Click on OK to apply the settings...
When using QlikView, we invariably come across some selections that we want to return to at a later time. We can create a bookmark by using the menu (Bookmarks | Add Bookmark), using the toolbar, or by pressing Ctrl + B. Another option is the Bookmark Object. This object lets us create and remove bookmarks from within the worksheet space.
Let's add a bookmark object to our Dashboard sheet by following these steps:
Right-click anywhere on the worksheet and select New Sheet Objects | Bookmark Object.
Enter Bookmarks into the Title input box.
Mark the Show Remove Button checkbox.
Under Button Alignment, select Vertical.
Click on OK to create the bookmark object.
Aligning and resizing sheet objects
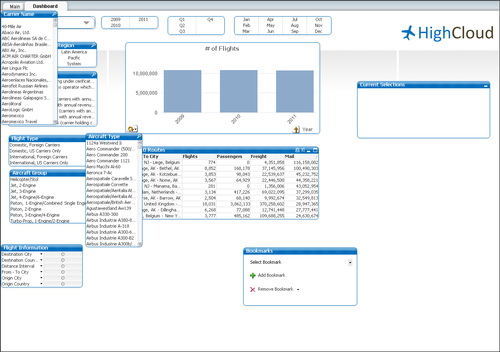
When we look at the results so far, we will notice that it looks very unorganized (as seen in the following screenshot). The objects are all over the place and are not aligned with the background. Of course, this is not very convenient for the user, so let's see how we can solve it.
To select a single object, simply click on its caption. To select multiple objects, activate all of them by either clicking and dragging around them with the mouse cursor ("lassoing"), or by clicking on their captions while keeping the Shift key pressed.
Objects (or a selected group of objects) can be moved by clicking on the caption bar and dragging them to the desired location. Objects without a caption (for example, the listboxes showing Year, Quarter, and Month that we created earlier) can be dragged by holding Alt and clicking and dragging anywhere on the object. This method also works for objects with a visible caption, and even for objects...
Creating and applying a default color map
Now there is only one thing left to do to finish styling up our document: apply the standard HighCloud color scheme to our charts.
We'll start by applying the HighCloud colors to the Traffic per Year chart. Follow these steps:
Right-click on the bar chart and select Properties….
Navigate to the Colors tab.
From the Data Appearance section, click on the first color button under the Colors 1-6 list, and the already familiar Color Area dialog will appear.
Change the Base Color to the already defined HighCloud Blue and close the Color Area window.
Then, click on the second color button from the color map and change it to HighCloud Brown.
Click on OK to close the Chart Properties window.
Once we've changed the color map, our chart will adopt the new colors in the order that was defined. At this time, only one color (HighCloud Blue) is used by the chart. However, we will use the same color map for all of our future charts, and some of them...
We've come to the end of the chapter, in which we learned to set document, sheet, and object properties. We've also learned how to add a background to aid the frontend layout, and also to apply a corporate identity to our document and set a default color map.
We learned how to create and use different objects, such as the listbox, the Current Selections Box, the Multi Box, and the Bookmark Object.
After preparing and setting the style used by the document, we can now continue to create and use the different data visualization objects available in QlikView. In the next chapter, we will look at building the charts and tables which will be used for dashboards, analysis, and reports.