Chapter 10. Advanced Expressions
The current frontend of our Airline Operations document is made up of charts that use straightforward aggregations, such as a Sum of values in a field. Dashboarding, however, often requires more complex calculations, depending on the nature of the data we are working with and the way some metrics should be calculated. Also, we often need to add certain context to the numbers; for instance, we might need to present the data in terms of relative growth (comparing current year versus last year), or create visualizations in a way that is not exactly "natural", in which case we could use calculated or synthetic dimensions.
In this chapter, we will dive into some of the complexities you can come across when developing a QlikView application. In summary, we will learn:
To expand the use of variables
To use conditional functions and If expressions
To handle advanced aggregations
So let's get to it.
Simply put, variables in QlikView are used to store data, either static or dynamic, and they can contain text, numbers, or any other data type. They are stored as a separate entity and are given a name to be able to reference them from any object in the whole document.
Even when one variable can store a single data value, their use can be extended to a much broader scope once we understand its inner workings.
At a general level, we
can say that variables in QlikView are used in two different ways:
To store a value or string either static or based on a formula. This type of variable can also be used to receive and interpret input from the user.
To store an expression definition that can be used in charts. This is an approach we explored in Chapter 6, Building Dashboards.
The main difference
between the previously mentioned options is that one calculates the output before sending it to the sheet object that makes use of the variable, whereas the other stores only the definition...
Using the TOTAL qualifier
The TOTAL qualifier is added to aggregation functions to disregard chart dimensions and make the calculation over the entire record set as defined by the current selection state.
In a previous section, we calculated the percentage of FTEs each carrier performs relative to the total number of FTEs and we used a variable (vTotalFTEs) to store the divisor value. Instead of using a variable, the same calculation can be made using the following expression:
When the preceding expression is used in a straight table with Carrier Name as the dimension, the numerator will calculate the value corresponding to each carrier, which will be different on each row of the table. The divisor will calculate the total number of flights made by all carriers, which will be the same for all rows of the table, therefore disregarding the dimension value.
Additional modifiers can be used along with the TOTAL qualifier to disregard only...
The output of the Aggr function can be likened to the list of values a straight table would display when evaluating an expression over a certain dimension. For instance, the following straight table has the Flight Type field as the dimension and Sum([# Departures Performed]) as the expression.
Essentially, the Aggr function creates a virtual straight table, similar to the earlier one, so that we can further process the list of values that would appear in the expression column, without even creating the actual object. The result of the Aggr function can be used to:
Let's see examples for both of these.
Using Aggr for nested aggregation
Since HighCloud
Airlines' users are interested in discovering key players in the industry from different perspectives, they now require a visualization object that clearly identifies carrier coverage of interstate...
There are several conditional functions in QlikView
that can be used in the frontend to give our charts a higher level of flexibility in terms of handling and presenting the data, both in expressions and dimensions. Let's go through some examples of these functions to enhance the analysis in our QlikView app.
Though sometimes
neglected because of its high resource usage when compared to other methods (such as Set Analysis, which is covered in the next chapter), the If function has important uses when creating QlikView documents. Essentially, it is used when two or more different outputs should result from a single expression, depending on a condition that is evaluated to either be true or false.
In this section, we'll explain how it works and discuss a use case.
As the first step, we should describe the syntax used by this function and the parameters it needs to work. If you've worked with Microsoft Excel previously, then it's very likely you...
A tip on copying expressions
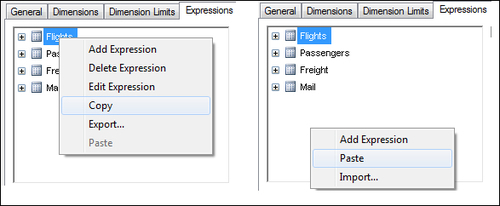
We will close this chapter on advanced expressions by sharing a tip that can save you quite some time when developing QlikView documents. You have noticed that, when defining a chart's expressions, we not only define the formula, but also expression attributes, number format, presentation, labels, alignment, and so on. It is very common that, when using more than one expression in a chart (a straight table, for instance), two or more of these expressions are very similar in terms of formatting and sometimes also in the formula itself.
In those cases, we can simply copy and paste an expression within the Expressions tab of the Chart Properties window to replicate the entire expression definition and then adjust whichever parameters or definitions we need to, thus saving a great deal of time and work.
To do this, simply right-click on the name of the expression you want to replicate and right-click again on the blank space below the expressions list to paste it.
We've come to the end of this chapter where we've been able to use some advanced techniques for data aggregation and advanced expressions. We have learned how to use variables in QlikView and embed them into expressions.
We also learned the use of conditional expressions, with the If function, to output results based on logical comparisons.
Finally, we learned how to use advanced and nested aggregations in charts.
In the next chapter, we will be learning about Set Analysis, one of QlikView's most powerful functionalities, and how it can be used for Point In Time reporting.