I suggest using the tools in Google Chrome for this book. The first tool that did a real good job was the Firefox tool called Firebug. Firebug is still a great tool, and the built-in developer tools in Firebug have made tremendous advances. You should also enjoy using the tools in Safari if you are a Mac user. If you are a die-hard fan of Internet Explorer, they have done a good job with the developer tools there as well. My point is, it is better to use developer tools everywhere, so don't make excuses to not use the developer tools in whatever browser you are using.
Note
If you happen to be working on or wanting to learn to build Chrome extensions and apps then here's how to enable developer mode. In the Chrome browser, click on the menu button next to the address bar. It is an icon with three lines stacked on top of each other. Under the selections on the side, click on Extensions, and you will see a checkbox at the top-right for Developer mode. Search on Google for more details as this is just a tip to whet your appetite.
When in Chrome, all you need to do to load the developer tools is press F12 on a PC, and on a Mac use Command + Alt + I. You can also find them by looking under the Chrome menu. This button can be found on the right of the address bar as three stacked lines. Under More tools you will see the option for developer tools.
You can see it there for Windows, Mac, and even for the browser on the Chrome OS. When you click on it, the following window appears at the bottom of the browser:
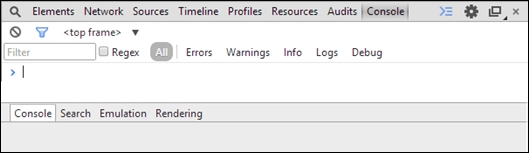
We will not get into all the features of this tool because that would demand an entire book. We are just going to focus on a few key features, making it easier to debug your code while learning Knockout. You may want to undock the tools from the bottom of the browser. To do so, click on the pair of stacked boxes right next to the close (x) button at the upper right. This makes the tools appear in a separate window.
The console is the main thing we are interested in at the moment, so if you do not have it selected, click on it in the top bar of the developer tools. This gives you a prompt that looks very similar to a command-line prompt. When you start typing text, if there are variables or structures active in the browser DOM, it will bring it up with code hinting.
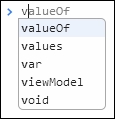
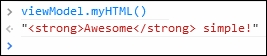
Select viewModel and then press the period. Notice that in the hinting there are all the model properties you created, listed with a few other variable settings. Select viewModel.myHtml and hit Enter. What you see is a function. To get the results you need to add parentheses to the end of the variable—for example, viewModel.myHtml()—and try again. You could retype it all, but you can also use the up and down arrows to cycle through recent command prompt entries if desired. This returns the value currently held in the ViewModel variable setting.
Now we take it to the next level and use the same variable to change the value right from the command prompt. What we need to do is to watch the screen closely as we press the Enter key because we can see the power of having the data bound to the View through the ViewModel. Enter the following in the command prompt:
viewModel.myHTML("Knockout is <strong>Awesome</strong>!")What you should see is the HTML of the second binding we entered updated automatically. That is a much easier way to work with the View than traditional JavaScript. For those who are wondering, it is also very compatible with jQuery. It can be used with all kinds of libraries though you should be careful to check them before considering them a match to make sure it is a good pair.
Note
You should also note that while we have been naming our ViewModel viewModel, it could be named any valid variable name. We are doing this just to help drive in the concept that this is our variable for the ViewModel.
Now let's use the balance in the calculation from the command console. Let's try entering the following:
viewModel.myBalance()*2
When we do, we should get -94.46 as the result, or another number if you entered in something different.
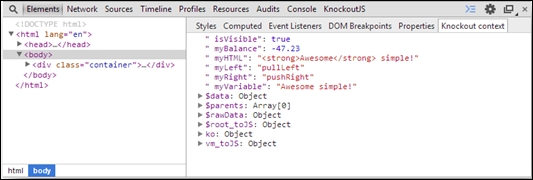
This is what the Knockout context shows when you are in the Elements view:
The add-in is available at the Chrome Web Store. It is a great store, and lots of the items worth getting are free. One of these items is the KnockoutJS context debugger which is released under an MIT license. The source code of this tool is on GitHub, which is very useful if you get large nested ViewModels. It has several features and provides great benefits when learning Knockout and building sites with it. To download this add-in use the following steps:
Type
knockoutin the search box.Under Extensions you should see Knockoutjs context debugger by timstuyckens.
Another thing that would help when working with Knockout or any data-binding library is the ability to trace what is going on. But this tool expands our reach beyond that ability. Select KnockoutJS from the top of the developer tools and you will see a button that says Enable Tracing. Click on it and go to the Console tab. Now enter the following code, and you will see all the changes to your DOM being dumped in the console window:
for(i=0;i<10;i++){viewModel.myBalance(1.1*i);}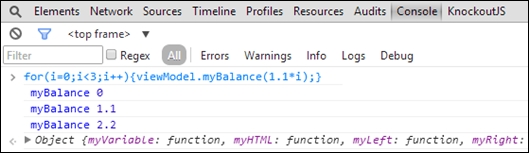
While this may be a big gain for those who have never fired up the developer tools in a browser, let's look at a few things that could make working with the tools even better. One of those things is shortcuts. Right beside the button to open the tools in their own window or put them back in the footer section of the browser window, there is a Settings button. Click on it and you will see three side menu items. The last one is Shortcuts. Skim through this and it will help all shortcut lovers to do things even faster. You can also find a full list of the shortcuts at https://developer.chrome.com/devtools/docs/shortcuts, which you could print out or perhaps just bookmark the page.
In the browser window where we have the "LEFT" content wrapped in our div tag, right-click on it and select Inspect Element. (On a Mac, you can use double fingers to do the right-click.) This selects the element, and you will be able to see any data-bind attribute settings that might exist for that element as well as any other DOM features.
You can even play around with the DOM and double-click inside the elements panel to edit the DOM live. Live editing is one of my favorite features. What you need to understand is that the View binds to the ViewModel when you instantiate it via a script. You cannot change that by editing the DOM code in that panel. You can also edit the CSS and JavaScript on the page for testing and debugging in amazing ways and this, in my opinion, is a must-learn developer skill.
It is an indispensable tool for me, when working with AJAX, to see what goes out and back using the Network Tab. You can see there is an XHR item in the listing, which allows you to view individual requests that arise while working on a page.
We at SOSensible, my company, have built all kinds of web applications. One kind of web application allows the user to go offline with a web app. We needed to store the data in a browser-based database store and this tool let us inspect all those resources under the Resources tab.
In the bottom section of the developer tools, there is a section called drawer. If it is not showing, the menu buttons at the top-right have a button to hide or show the drawer. Once it is visible, you have a menu item for Emulation. This lets you refresh the screen to show a close emulation of what the view would be like on a particular device size and rotation.
There are a couple of items on the sidebar that also help with other features. There is a setting called Device to pick the device to emulate. There is a setting named Screen to manage the rotation and many other features you may want to customize. There is also User Agent to spoof the server into thinking it is a different device. Lastly, there is Sensors that allows you to set geolocation and accelerometer values.