


Chi-square distribution
Researchers are often faced with the need to test hypotheses on categorical data. The parametric tests covered in Chapter 4, Parametric Tests, are often not very helpful for this type of analysis. In the last chapter, we discussed using an F-test to compare sample variances. Extending that concept, we can consider the non-parametric and non-symmetric chi-square probability distribution, which is a distribution useful for comparing the means of sampling distribution variances to their population variances, specifically when the mean of a sampling distribution of sample variances is expected to equal the population variance under the null hypothesis. Because variance cannot be negative, the distribution starts at an origin of 0. Here, we can see the chi-square distribution:
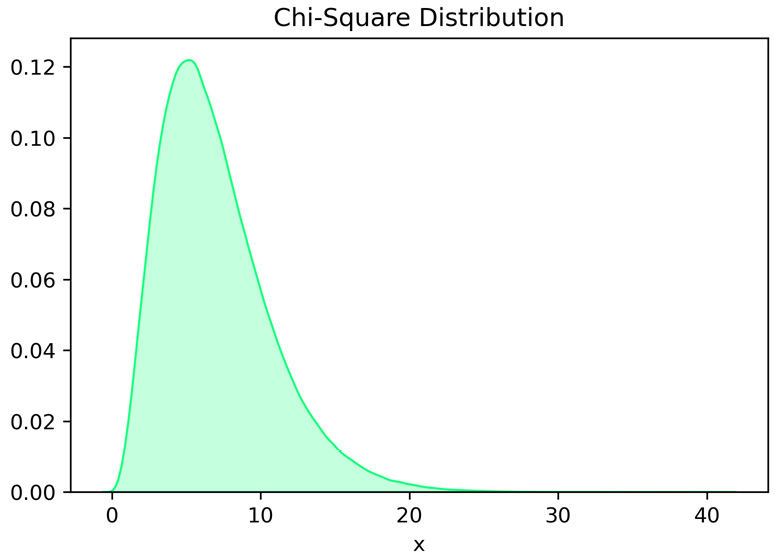
Figure 5.5 – Chi-square distribution with seven degrees of freedom
The shape of the chi-square distribution does not represent an assumption that percentiles...


