


PLOTTING MULTIPLE LINES IN MATPLOTLIB
Listing 5.16 displays the contents of plt_array2.py that illustrates the ease with which you can plot multiple lines in Matplotlib.
Listing 5.16: plt_array2.py
import matplotlib.pyplot as plt

x = [7,11,13,15,17,19,23,29,31,37]
data = [[8, 4, 1], [5, 3, 3], [6, 0, 2], [1, 7, 9]]
plt.plot(data, 'd-')
plt.show()
Listing 5.16 defines the array data that contains a hard-coded set of values. The Pyplot API plot() uses the variable data to display a line segment. Figure 5.11 displays multiple lines based on the code in Listing 5.16.
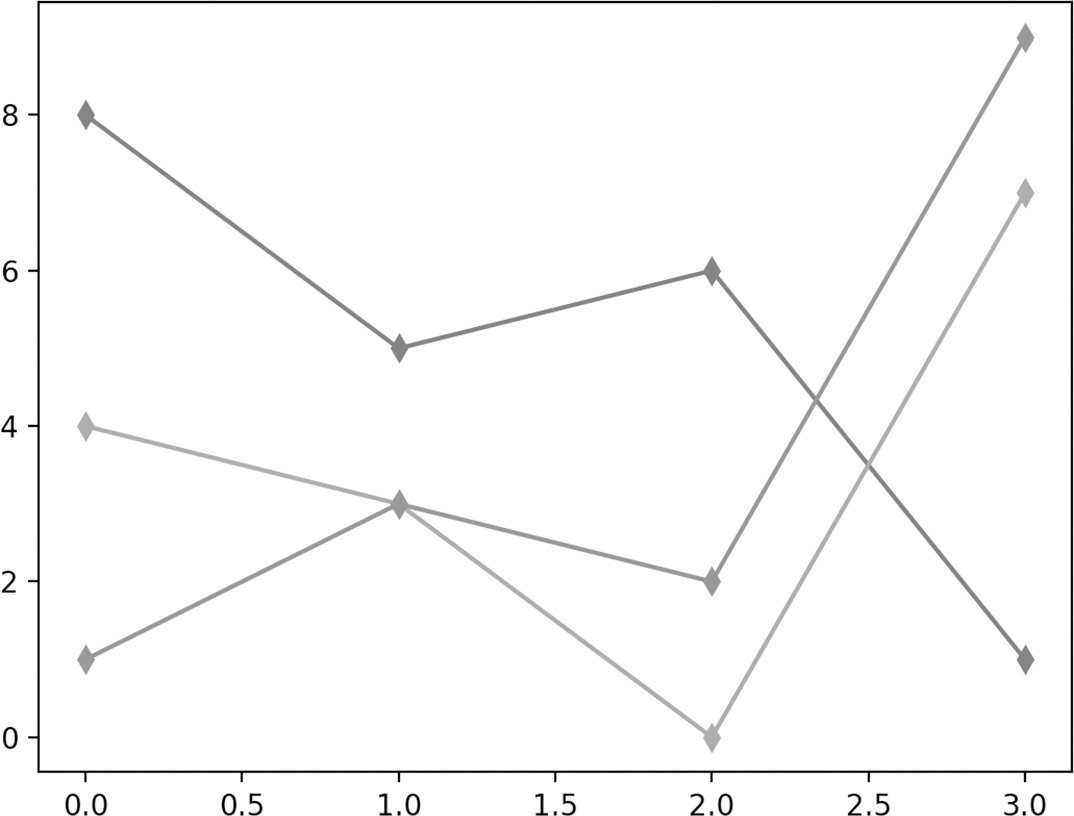
FIGURE 5.11 Multiple lines in Matplotlib.
Now let’s look at a simple dataset consisting of discrete data points, which is the topic of the next section.


