Search icon
Arrow left icon
All Products
Best Sellers
New Releases
Books
Videos
Audiobooks
Learning Hub
Newsletters
Free Learning
Arrow right icon
Master Apache JMeter - From Load Testing to DevOps

You're reading from  Master Apache JMeter - From Load Testing to DevOps

Product type Book
Published in Aug 2019
Publisher
ISBN-13 9781839217647
Pages 468 pages
Edition 1st Edition
Languages
Authors (3):
Antonio Gomes Rodrigues Antonio Gomes Rodrigues
Profile icon Antonio Gomes Rodrigues
Bruno Demion (Milamber) Bruno Demion (Milamber)
Profile icon Bruno Demion (Milamber)
Philippe Mouawad Philippe Mouawad
Profile icon Philippe Mouawad
View More author details

Table of Contents (14) Chapters

About the Book 1. Quick Start with JMeter 2. JMeter Overview 3. Designing a Test Case 4. Important Concepts in JMeter 5. Preparing the Test Environment (Injectors and Tested Systems) 6. Being Productive with JMeter 7. Load Testing a Website 8. Load Testing Web Services 9. Load Testing a Database Server 10. Load Testing Message-Oriented Middleware (MOM) via JMS 11. Performing a Load Test 12. Visualizing and Analyzing the Load Testing Results 13. Integration of JMeter in the DevOps Tool Chain

Run Our Load Test and Analyze It

  1. Before launching our test, one last tip is to ask JMeter to generate an HTML report at the end.

    For this, we will use the following command line:

    <JMETER_HOME>/bin/jmeter -n -t [jmx file] -l [results file] -e -o [Path\ to output folder]

  2. Let's run our test and see what happens.

    In our terminal:

    Figure 1.30: Follows a load test in the terminal
    Figure 1.30: Follows a load test in the terminal
  3. In Grafana (the dashboard used is one of those proposed in the Grafana website (https://grafana.com/dashboards/3351)):

    Note

    We can use this dashboard, too: https://grafana.com/dashboards/5496.

    Figure 1.31: Real-time monitoring in Grafana
    Figure 1.31: Real-time monitoring in Grafana
    Figure 1.32: Real-time monitoring in Grafana
    Figure 1.32: Real-time monitoring in Grafana
  4. At the end of our test, we get the HTML dynamic Web Report with 17 graphs, an APDEX (https://en.wikipedia.org/wiki/Apdex) table, a statistics table (showing response times, error rates, network metrics…), a table with an errors summary, and a table with Top5errors per sampler. So, you get everything you need to analyze your load test:
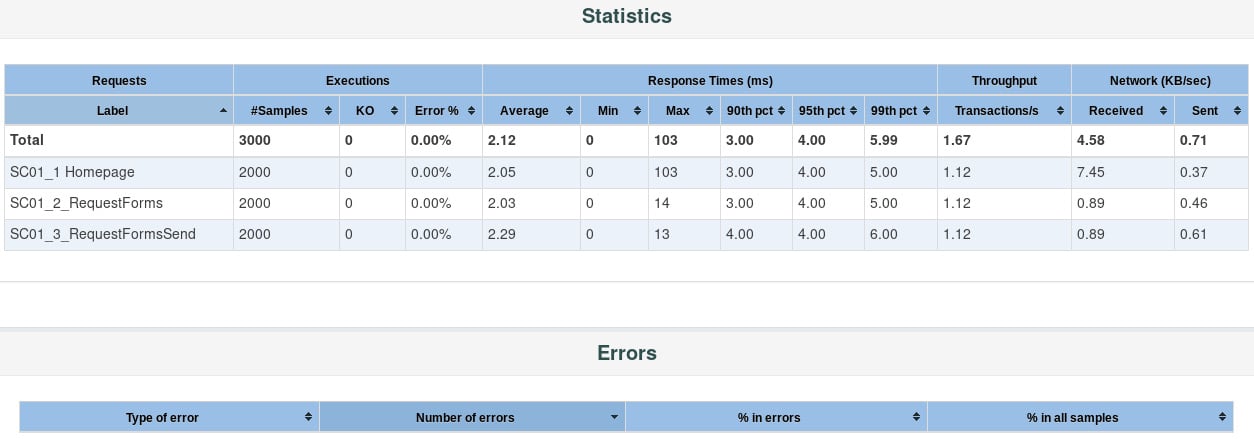
Figure 1.33: HTML report
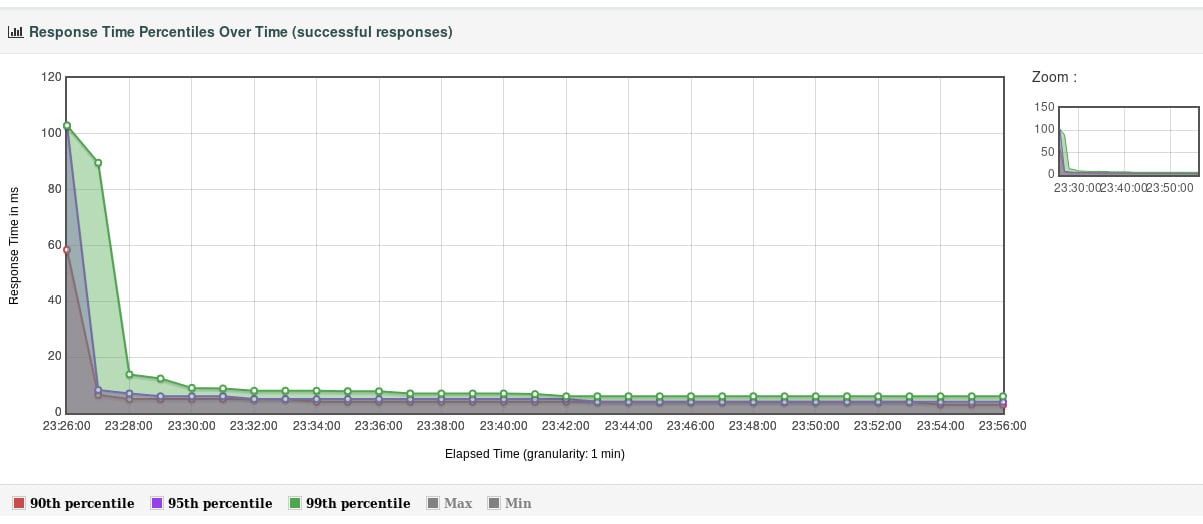
Figure 1.34: HTML report

The icing on the cake is a CSV file we get at the end of our test; this format is usable by many tools to visualize the results differently.

In this chapter, we have seen how to quickly get started with JMeter to perform a simple load test.

You have been reading a chapter from
Master Apache JMeter - From Load Testing to DevOps
Published in: Aug 2019 Publisher: ISBN-13: 9781839217647
Register for a free Packt account to unlock a world of extra content!
A free Packt account unlocks extra newsletters, articles, discounted offers, and much more. Start advancing your knowledge today.
Unlock this book and the full library FREE for 7 days
Get unlimited access to 7000+ expert-authored eBooks and videos courses covering every tech area you can think of
Renews at €14.99/month. Cancel anytime}