Chapter 4. Predicting Values with Regression
In this chapter, we'll cover multiple linear regression and how to approach it from a TDD perspective. Unlike the previous chapters, where we developed the actual algorithm using TDD, in this chapter we will explore using a third-party library for the algorithm and TDD building our model. In order to do this, we'll need to find a way to quantify model quality as well as to quantify model assumption violations. We won't have the liberty of checking a data visualization to ensure that our model fits our criteria well.
We will also be using the Python packages statsmodels and pandas, so install those before moving forward in the chapter, using the following commands;
To start off, let's refresh ourselves on multiple regression and the key topics we'll need to drive us toward an excellent model.
Refresher on advanced regression
Before we get down to brass tacks on how we will tackle building regression models using TDD, we need to refresh ourselves on some of the finer points. Multiple regression comes packed with some assumptions and different measures of model quality. A good amount of this information can be found in A Second Course in Statistics Regression Analysis, Mendenhall & Sincich, Pearson (2011).
When a lot of people are introduced to regression, their main take-away is this is how we draw a line through our data to predict what it will be. To be fair, that's pretty accurate, but there's a fair amount of nuance in this that we need to explicitly discuss.
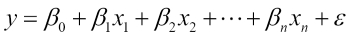
First let's discuss the standard multiple regression model form. It looks like this:
Here y is our dependent variable. Every x variable is an independent variable. y being a dependent variable means it is dependent on the values of the independent variables and the error term  . The error term is...
When exploring machine learning algorithms, it can be quite helpful to generate your own data. This gives you complete control and allows for the most exploration of a new technique you might try. It also lets you build trust that your model is working as planned given your assumptions. You've seen this multiple times already in this book up to this point, so it's nothing new. As we develop a linear regression model however, it will be even more instructive since I'm going to work backward through the example.
I will generate data first but show you how I generated the data at the end of the chapter. The goal here is to give you the opportunity to work through building a complex model from a statistical test-first perspective and ultimately show how the generating function was defined and how that affected our work.
The generated data is in the GitHub repo for this book (https://github.com/jcbozonier/Machine-Learning-Test-by-Test) so that you can follow along with the...
Building the foundations of our model
Let's start by pulling the model into Python and transforming it into a form that we can use. To do this, we will need two additional libraries. We will use Pandas to read from our generated CSV and statsmodel to run our statistical procedures. Both libraries are pretty powerful and full of features, and we will only be touching on a few of them so feel free to explore them further later.
To start off, let's make a test that will run a simple regression over one of the variables and show us the output. That should give us a good place to start. I'm keeping this in a unit testing structure because I know I want to test this code and just want to explore a bit to know exactly what to test for. This first step you could do in a one-off file, but I'm choosing to start with it so I can build from it:
Cross-validating our model
Now before we cheat and look at our answer key, let's see how well this solution does at predicting data it hasn't seen. To do this, I write the following fairly large test:
Now that we've gone through the process of searching for the right model, let's talk about what the model's true parameters were and how they line up with the parameters our regression generated.
This is the code that was used to generate the data:
In this chapter, we stepped through what it takes to drive building a multiple regression model using the same unit test techniques we've been using to develop code.
In the next chapter, we will continue with exploring regression but will move on to logistic regression. Rather than predicting values, we'll use logistic regression to classify data into one group or another.