


SLANTED LINES IN MATPLOTLIB
Listing 5.6 displays the content of diagonallines.py that illustrates how to plot slanted lines.
LISTING 5.6: diagonallines.py
import matplotlib.pyplot as plt
import numpy as np

x1 = np.linspace(-5,5,num=200)
y1 = x1

x2 = np.linspace(-5,5,num=200)
y2 = -x2

plt.axis([-5, 5, -5, 5])
plt.plot(x1,y1)
plt.plot(x2,y2)
plt.show()
Listing 5.6 defines two lines using the technique that you saw in Listing 5.5, except that these two lines define y1 = x1 and y2 = -x2, which produces slanted lines instead of horizontal lines.
Figure 5.3 displays two slanted line segments whose equations are defined in Listing 5.6.
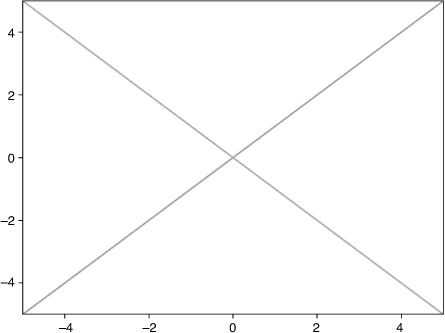
FIGURE 5.3 A graph of two slanted line segments


