Search icon CANCEL
Subscription
0
Cart icon
Your Cart (0 item)
Close icon
You have no products in your basket yet
Save more on your purchases! discount-offer-chevron-icon
Savings automatically calculated. No voucher code required.
Arrow left icon
Explore Products
Best Sellers
New Releases
Books
Videos
Audiobooks
Learning Hub
Newsletter Hub
Free Learning
Arrow right icon
timer SALE ENDS IN
0 Days
:
00 Hours
:
00 Minutes
:
00 Seconds
Arrow up icon
GO TO TOP
Learning .NET High-Performance Programming

You're reading from   Learning .NET High-Performance Programming Learn everything you need to know about performance-oriented programming for the .NET Framework

Arrow left icon
Product type Paperback
Published in Jun 2015
Publisher Packt
ISBN-13 9781785288463
Length 304 pages
Edition 1st Edition
Languages
Arrow right icon
Author (1):
Arrow left icon
Antonio Esposito Antonio Esposito
Author Profile Icon Antonio Esposito
Antonio Esposito
Arrow right icon
View More author details
Toc

Table of Contents (11) Chapters Close

Preface 1. Performance Thoughts 2. Architecting High-performance .NET Code FREE CHAPTER 3. CLR Internals 4. Asynchronous Programming 5. Programming for Parallelism 6. Programming for Math and Engineering 7. Database Querying 8. Programming for Big Data 9. Analyzing Code Performance Index

Profiling with Visual Studio


Visual Studio has a great profiling tool integrated within its usual IDE.

The main menu root is ANALYZE. Here, we find all we need to understand an application's performance details, together with interesting static analysis tools to verify a programmer's skill.

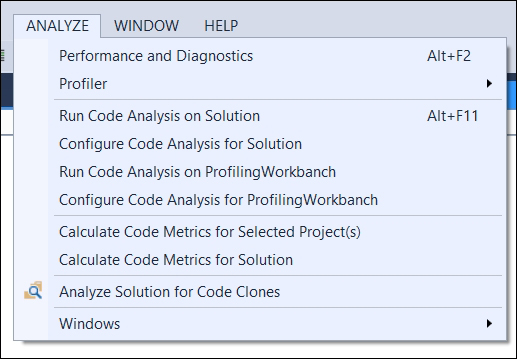
The ANALYZE menu as visible within Visual Studio 2013 update 4

Here's a brief guide to how to start profiling our application:

  1. Within the menu, click on the Performance and Diagnostics menu item. This link opens the main window to start profiling our applications. Using the performance wizard helps us in selecting the best profiling technique and configuration for our needs. Specific profilers also exist for specific application kinds, such as JavaScript memory usage or GPU power usage.

    The performance and diagnostics window, ready to start profiling a WPF application

  2. By pressing the start button at the bottom of the window, we will see the Performance Wizard asking us which profiling technology we want to...

lock icon The rest of the chapter is locked
CONTINUE READING
83
Tech Concepts
36
Programming languages
73
Tech Tools
Icon Unlimited access to the largest independent learning library in tech of over 8,000 expert-authored tech books and videos.
Icon Innovative learning tools, including AI book assistants, code context explainers, and text-to-speech.
Icon 50+ new titles added per month and exclusive early access to books as they are being written.
Learning .NET High-Performance Programming
Register for a free Packt account to unlock a world of extra content!
A free Packt account unlocks extra newsletters, articles, discounted offers, and much more. Start advancing your knowledge today.
Unlock this book and the full library FREE for 7 days
Get unlimited access to 7000+ expert-authored eBooks and videos courses covering every tech area you can think of
Renews at AU $24.99/month. Cancel anytime
Modal Close icon
Modal Close icon