


A SET OF LINE SEGMENTS IN MATPLOTLIB
Listing 5.15 displays the contents of line_segments.py that illustrates how to plot a set of connected line segments in Matplotlib.
Listing 5.15: line_segments.py
import numpy as np
import matplotlib.pyplot as plt

x = [7,11,13,15,17,19,23,29,31,37]

plt.plot(x) # OR: plt.plot(x, 'ro-') or bo
plt.ylabel('Height')
plt.xlabel('Weight')
plt.show()
Listing 5.15 defines the array x that contains a hard-coded set of values. The Pyplot API plot() uses the variable x to display a set of connected line segments. Figure 5.10 displays the result of launching the code in Listing 5.16.
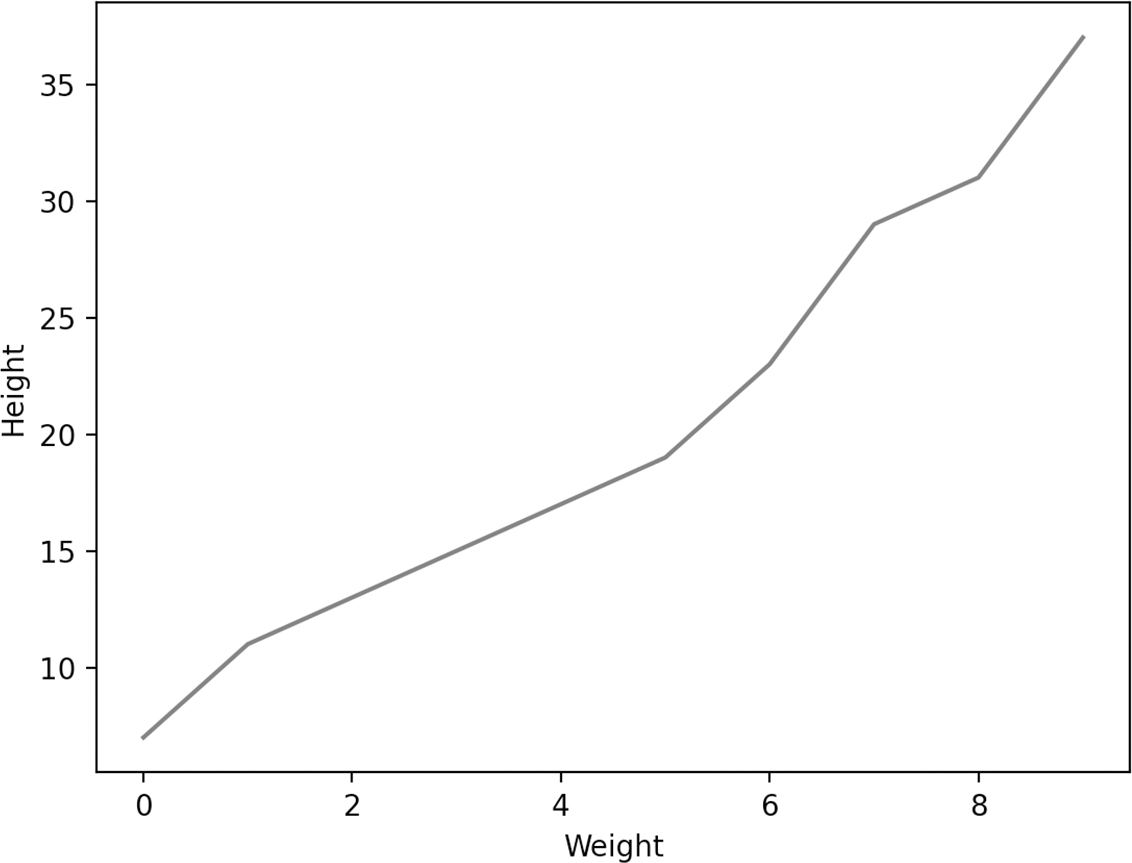
FIGURE 5.10 A set of connected line segments.


