Search icon
Arrow left icon
All Products
Best Sellers
New Releases
Books
Videos
Audiobooks
Learning Hub
Newsletters
Free Learning
Arrow right icon
Advanced Analytics with R and Tableau

You're reading from  Advanced Analytics with R and Tableau

Product type Book
Published in Aug 2017
Publisher Packt
ISBN-13 9781786460110
Pages 178 pages
Edition 1st Edition
Languages
Authors (3):
Ruben Oliva Ramos Ruben Oliva Ramos
Profile icon Ruben Oliva Ramos
Jen Stirrup Jen Stirrup
Profile icon Jen Stirrup
Roberto Rösler Roberto Rösler
View More author details

Table of Contents (16) Chapters

Advanced Analytics with R and Tableau
Credits
About the Authors
About the Reviewers
www.PacktPub.com
Customer Feedback
Preface
1. Advanced Analytics with R and Tableau 2. The Power of R 3. A Methodology for Advanced Analytics Using Tableau and R 4. Prediction with R and Tableau Using Regression 5. Classifying Data with Tableau 6. Advanced Analytics Using Clustering 7. Advanced Analytics with Unsupervised Learning 8. Interpreting Your Results for Your Audience Index

Chapter 3. A Methodology for Advanced Analytics Using Tableau and R

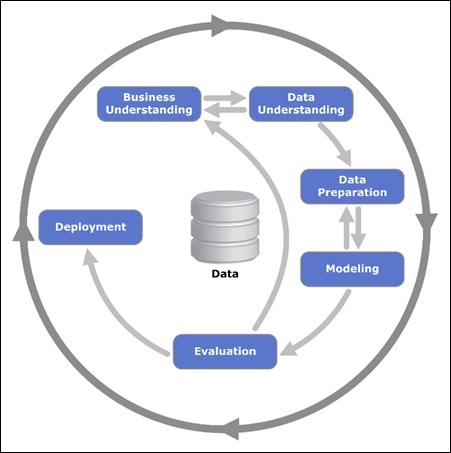
In the era of big data when lack of methodology is likely to produce random and false discoveries, a robust framework for delivery is extremely important. According to a Dataversity poll in 2015, it was found that only 17% of survey respondents said they had a well-developed Predictive or Prescriptive Analytics program in place. On the other hand, 80% of respondents said they planned on implementing such a program within five years. How can we ensure that our projects are successful?

There is an increasing amount of data in the world, and in our databases. The data deluge is not going to go away anytime soon! Businesses risk wasting the useful business value of information contained in databases, unless they are able to excise useful knowledge from the data.

There is a saying in the world of data: garbage in, garbage out. Data needs to be cleaned before it is turned into information. There is a difference between original...

Industry standard methodologies for analytics


There are a few main methodologies: the Microsoft TDSP Process and the CRISP-DM methodology.

Ultimately, they are all setting out to achieve the same objectives as an analytics framework. There are differences, of course, and these are highlighted here. CRISP-DM and TDSP focus on the business value and the results derived from analytics projects.

Both of these methodologies are described in the following sections.

CRISP-DM


One common methodology is the CRISP-DM methodology (the modeling agency). The Cross Industry Standard Process for Data Mining or (CRISP-DM) model as it is known, is a process model that provides a fluid framework for devising, creating, building, testing, and deploying machine learning solutions. The process is loosely divided into six main phases. The phases can be seen in the following diagram:

CRISP-DM Methodology

Initially, the process starts with a business idea and a general consideration of the data. Each stage is briefly discussed in the following sections.

Business understanding/data understanding

The first phase looks at the machine learning solution from a business standpoint, rather than a technical standpoint. The business idea is defined, and a draft project plan is generated. Once the business idea is defined, the data understanding phase focuses on data collection and familiarity. At this point, missing data may be identified, or initial insights may be revealed. This...

Team Data Science Process


The TDSP process model provides a dynamic framework to machine learning solutions that have been through a robust process of planning, producing, constructing, testing, and deploying models. Here is an example of the TDSP process:

The process is loosely divided into four main phases:

  • Business Understanding

  • Data Acquisition and Understanding

  • Modeling

  • Deployment

The phases are described in the following paragraphs.

Business understanding

The Business understanding process starts with a business idea, which is solved with a machine learning solution. The business idea is defined from the business perspective, and possible scenarios are identified and evaluated. Ultimately, a project plan is generated for delivering the solution.

Data acquisition and understanding

Following on from the business understanding phase is the data acquisition and understanding phase, which concentrates on...

Working with dirty data


The process of cleaning data involves tidying the data, which usually results in making the dataset smaller because we have cleaned out some of the dirty data. What makes data dirty?

Dirty data can be due to invalid data, which is data that is false, incomplete, or doesn't conform to the accepted standard. An example of invalid data could be formatting errors, or data that is out of an acceptable range. Invalid data could also have the wrong type. For example, the Asterix is invalid because the acceptable formatted data is for letters only, so it can be removed.

Dirty data can be due to missing data, which is data where no value is stored. An example of missing data is data that has not been stored due to a faulty sensor. We can see that some data is missing, so it is removed from consideration.

Dirty data could also have null values. If data has null values, then programs may respond differently to the data on that basis. The nulls will need to be considered in order...

Introduction to dplyr


What is dplyr? Well, dplyr can be perceived as a grammar of data manipulation. It has been created for the R community by Hadley Wickham, Romain Francois, and RStudio.

What does dplyr give the Tableau user? We will use dplyr in order to cleanse, summarize, group, chain, filter, and visualize our data in Tableau.

Summarizing the data with dplyr

Firstly, let's import the packages that we need. These packages are listed in the following table, followed by the code itself.

Packages required for the hands-on exercise:

Package Name

Description

Reference

WDI

Search, extract, and format data from the World Bank's World Development Indicators

https://cran.r-project.org/web/packages/WDI/index.html

dplyr

dplyr is a grammar of data manipulation


As we walk through the script, the first thing we need to do is install the packages.

Once you have installed the packages, we need to call each library.

Once we have called the libraries, then we need to obtain the data from the...

Summary


Data science requires a process to ensure that the project is successful. As we have seen from the previous frameworks, it requires many moving parts from the extraction of timely data from diverse data sources, building and testing the models, and then deploying those models to aid in or to automate day-to-day decision making processes. Otherwise, the project can easily fall through the gaps in this data so that the organization is right where they started: data rich, information poor.

In this example, we have covered the CRISP-DM methodology and the TDSP methodology. Each of these stages has the data preparation stage clearly marked out. In order to follow this sequence, we have started with a focus on the data preparation stage using the dplyr package in R. We have cleaned some data and compared the results between the dirty and clean data.

lock icon The rest of the chapter is locked
You have been reading a chapter from
Advanced Analytics with R and Tableau
Published in: Aug 2017 Publisher: Packt ISBN-13: 9781786460110
Register for a free Packt account to unlock a world of extra content!
A free Packt account unlocks extra newsletters, articles, discounted offers, and much more. Start advancing your knowledge today.
Unlock this book and the full library FREE for 7 days
Get unlimited access to 7000+ expert-authored eBooks and videos courses covering every tech area you can think of
Renews at AU $19.99/month. Cancel anytime}