
Matplotlib
In deep learning experiments, drawing graphs and visualizing data is important. With Matplotlib, you can draw visualize easily by drawing graphs and charts. This section describes how to draw graphs and display images.
Drawing a Simple Graph
You can use Matplotlib's pyplot module to draw graphs. Here is an example of drawing a sine function:
import numpy as np
import matplotlib.pyplot as plt
# Create data
x = np.arange(0, 6, 0.1) # Generate from 0 to 6 in increments of 0.1
y = np.sin(x)
# Draw a graph
plt.plot(x, y)
plt.show()
Here, NumPy's arange method is used to generate the data of [0, 0.1, 0.2, …, 5.8, 5.9] and name it x. NumPy's sine function, np.sin(), is applied to each element of x, and the data rows of x and y are provided to the plt.plot method to draw a graph. Finally, a graph is displayed by plt.show(). When the preceding code is executed, the image shown in Figure 1.3 is displayed:
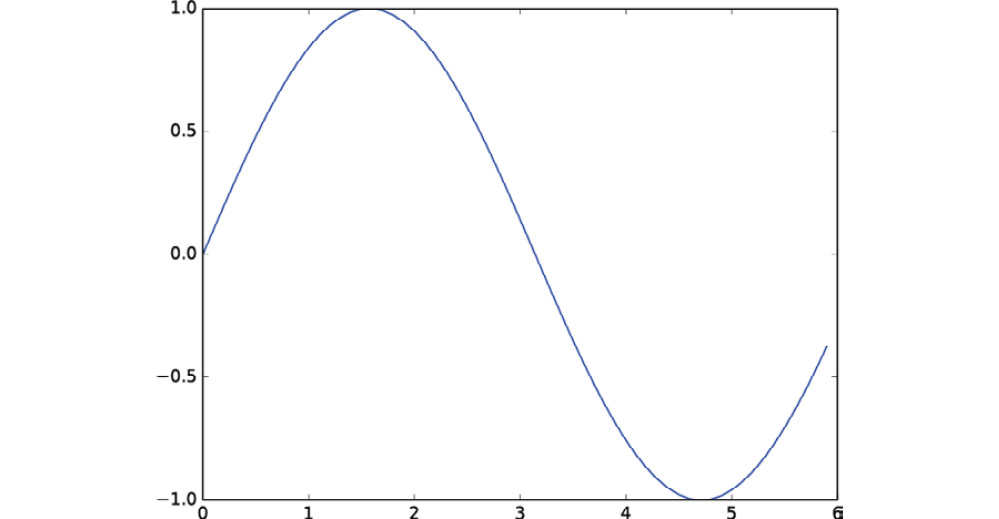
Figure 1.3: Graph of a sine function
Features of pyplot
Here, we will draw a cosine function (cos) in addition to the sine function (sin) we looked at previously. We will use some other features of pyplot to show the title, the label name of the x-axis, and so on:
import numpy as np
import matplotlib.pyplot as plt
# Create data
x = np.arange(0, 6, 0.1) # Generate from 0 to 6 in increments of 0.1
y1 = np.sin(x)
y2 = np.cos(x)
# Draw a graph
plt.plot(x, y1, label="sin")
plt.plot(x, y2, linestyle = "--", label="cos") # Draw with a dashed line
plt.xlabel("x") # Label of the x axis
plt.ylabel("y") # Label of the y axis
plt.title('sin & cos') # Title
plt.legend()
plt.show()
Figure 1.4 shows the resulting graph. You can see that the title of the graph and the label names of the axes are displayed:
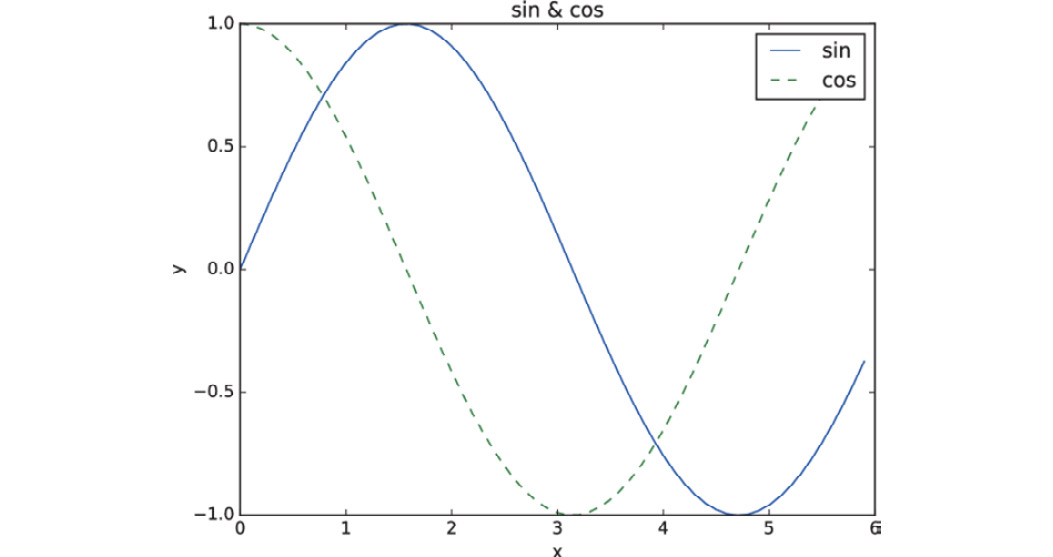
Figure 1.4: Graph of sine and cosine functions
Displaying Images
The imshow() method for displaying images is also provided in pyplot. You can use imread() in the matplotlib.image module to load images, as in the following example:
import matplotlib.pyplot as plt
from matplotlib.image import imread
img = imread('lena.png') # Load an image (specify an appropriate path!)
plt.imshow(img)
plt.show()
When you execute this code, the image shown in Figure 1.5 is displayed:
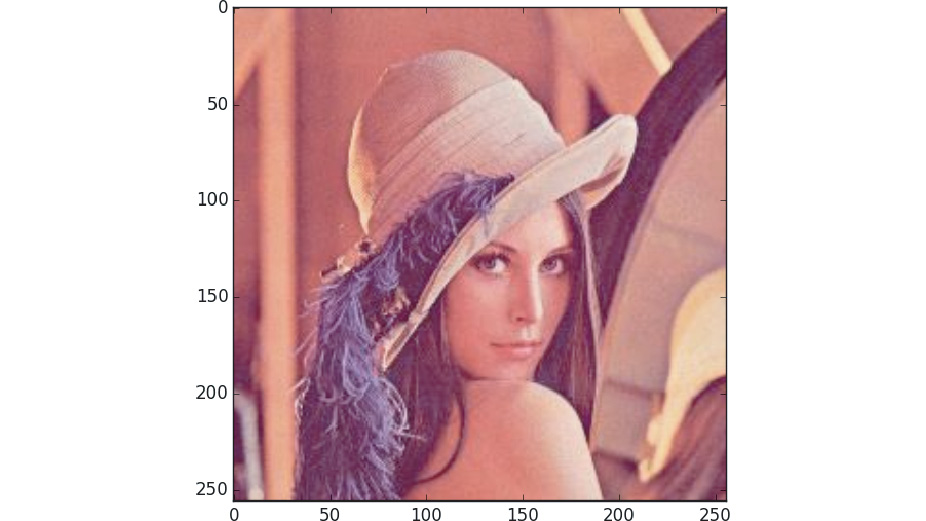
Figure 1.5: Displaying an image
Here, it is assumed that the image, lena.png, is located in the current directory. You need to change the name and path of the file as required, depending on your environment. In the source code provided with this book, lena.png is located under the dataset directory as a sample image. For example, to execute the preceding code from the ch01 directory in the Python interpreter, change the path of the image from lena.png to ../dataset/lena.png for proper operation.