


SEABORN HEAT MAPS
Listing 5.36 displays the contents sns_heatmap1.py that displays a heat map from a Seaborn built-in dataset.
Listing 5.36: sns_heatmap1.py
import seaborn as sns
import matplotlib.pyplot as plt

data = sns.load_dataset("flights")
data = data.pivot("month", "year", "passengers")

print("data.head():")
print(data.head())

sns.heatmap(data)
plt.show()
Listing 5.36 contains import statements and then initializes the variable data with the built-in flights dataset. The next code snippet invokes the pivot() method that “inverts” the row and columns of the dataset. The final code portion of Listing 5.36 displays the first five rows of the dataset and then generates a heat map based on the dataset. The output from Listing 5.37 is here:
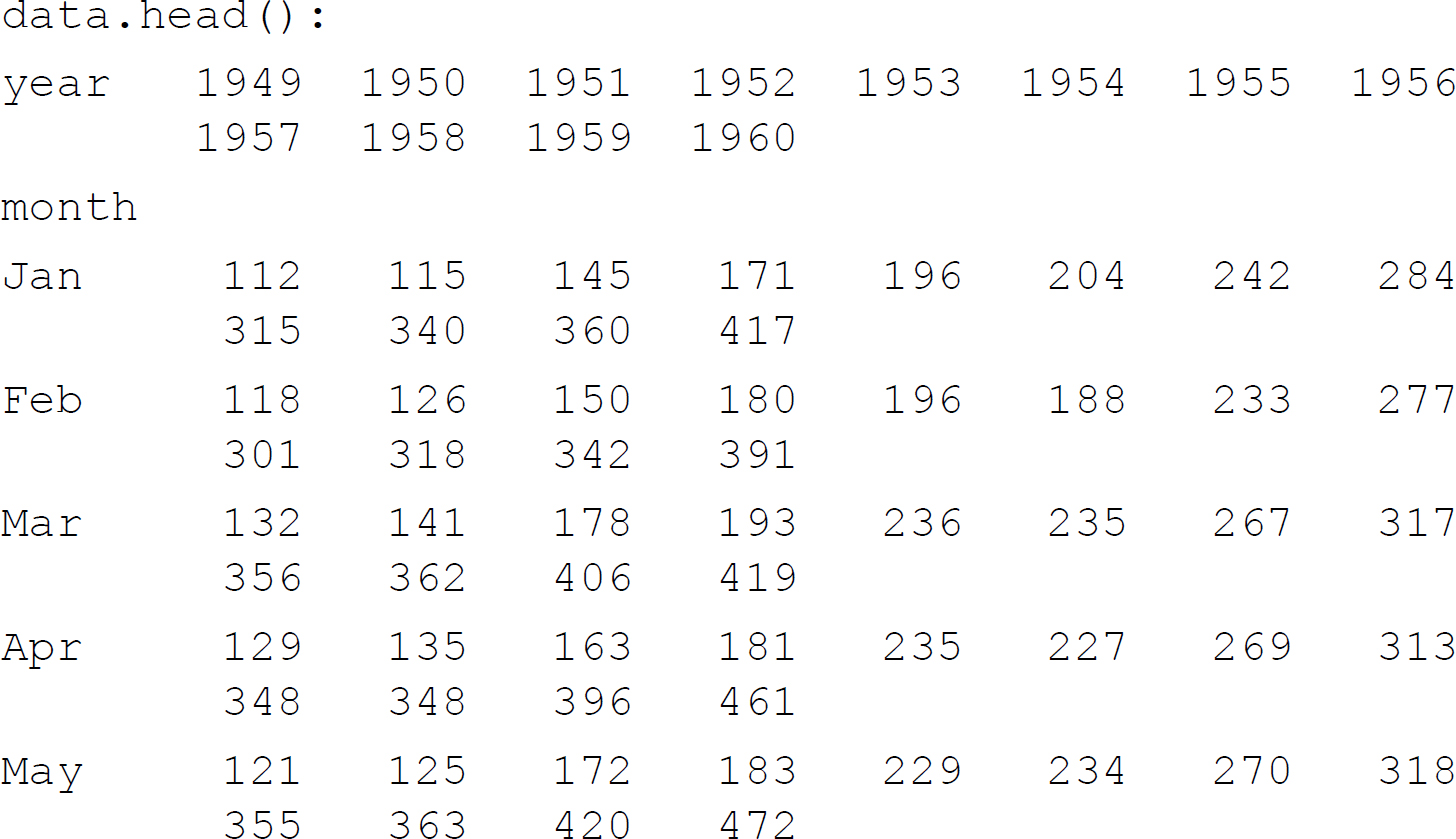
Figure 5.23 displays a plot of the data in the Titanic dataset based on the code in Listing 5.36.
FIGURE 5.23 A Pandas DataFrame displayed via Seaborn.


