
Non-Parametric Tests
In the previous chapter, we discussed parametric tests. Parametric tests are useful when test assumptions are met. However, there are cases where those assumptions are not met. In this chapter, we will discuss several non-parametric alternatives to the parametric tests presented in the previous chapter. We start by introducing the concept of a non-parametric test. Then, we will discuss several non-parametric tests that can be used when t-test or z-test assumptions are not met.
In this chapter, we’re going to cover the following main topics:
- When parametric test assumptions are violated
- The rank-sum test
- The signed-rank test
- The Kruskal-Wallis test
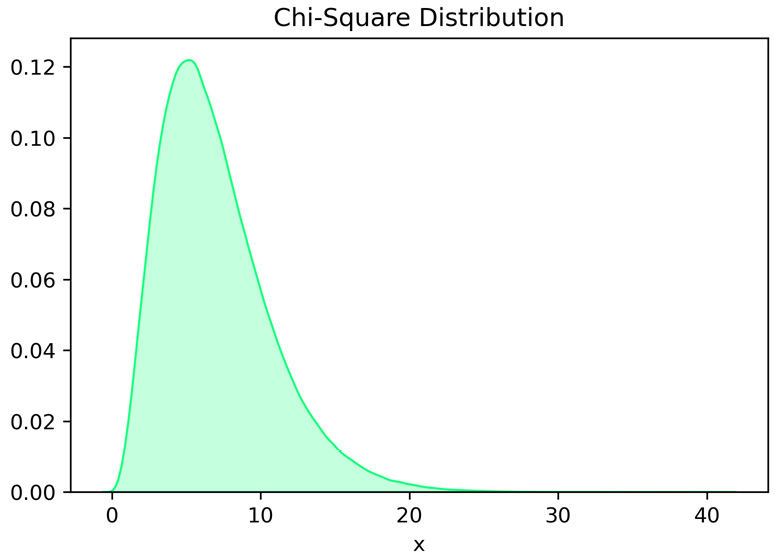
- The chi-square test
- Spearman’s correlation analysis
- Chi-square power analysis