Search icon
Arrow left icon
All Products
Best Sellers
New Releases
Books
Videos
Audiobooks
Learning Hub
Newsletters
Free Learning
Arrow right icon
Building Machine Learning Systems with Python

You're reading from  Building Machine Learning Systems with Python

Product type Book
Published in Jul 2013
Publisher Packt
ISBN-13 9781782161400
Pages 290 pages
Edition 1st Edition
Languages

Table of Contents (20) Chapters

Building Machine Learning Systems with Python
Credits
About the Authors
About the Reviewers
www.PacktPub.com
Preface
1. Getting Started with Python Machine Learning 2. Learning How to Classify with Real-world Examples 3. Clustering – Finding Related Posts 4. Topic Modeling 5. Classification – Detecting Poor Answers 6. Classification II – Sentiment Analysis 7. Regression – Recommendations 8. Regression – Recommendations Improved 9. Classification III – Music Genre Classification 10. Computer Vision – Pattern Recognition 11. Dimensionality Reduction 12. Big(ger) Data Where to Learn More about Machine Learning Index

Chapter 5. Classification – Detecting Poor Answers

Now that we are able to extract useful features from text, we can take on the challenge of building a classifier using real data. Let's go back to our imaginary website in Chapter 3, Clustering – Finding Related Posts, where users can submit questions and get them answered.

A continuous challenge for owners of these Q&A sites is to maintain a decent level of quality in the posted content. Websites such as stackoverflow.com take considerable efforts to encourage users to score questions and answers with badges and bonus points. Higher quality content is the result, as users are trying to spend more energy on carving out the question or crafting a possible answer.

One particular successful incentive is the possibility for the asker to flag one answer to their question as the accepted answer (again, there are incentives for the asker to flag such answers). This will result in more score points for the author of the flagged answer.

Would it...

Sketching our roadmap


We will build a system using real data that is very noisy. This chapter is not for the fainthearted, as we will not arrive at the golden solution for a classifier that achieves 100 percent accuracy. This is because even humans often disagree whether an answer was good or not (just look at some of the comments on the stackoverflow.com website). Quite the contrary, we will find out that some problems like this one are so hard that we have to adjust our initial goals on the way. But on that way, we will start with the nearest neighbor approach, find out why it is not very good for the task, switch over to logistic regression, and arrive at a solution that will achieve a good prediction quality but on a smaller part of the answers. Finally, we will spend some time on how to extract the winner to deploy it on the target system.

Learning to classify classy answers


While classifying, we want to find the corresponding classes, sometimes also called labels, for the given data instances. To be able to achieve this, we need to answer the following two questions:

  • How should we represent the data instances?

  • Which model or structure should our classifier possess?

Tuning the instance

In its simplest form, in our case, the data instance is the text of the answer and the label is a binary value indicating whether the asker accepted this text as an answer or not. Raw text, however, is a very inconvenient representation to process for most of the machine learning algorithms. They want numbers. It will be our task to extract useful features from raw text, which the machine learning algorithm can then use to learn the right label.

Tuning the classifier

Once we have found or collected enough (text and label) pairs, we can train a classifier. For the underlying structure of the classifier, we have a wide range of possibilities, each of...

Fetching the data


Luckily for us, the team behind stackoverflow provides most of the data behind the StackExchange universe to which stackoverflow belongs under a CC Wiki license. While writing this, the latest data dump can be found at http://www.clearbits.net/torrents/2076-aug-2012. Most likely, this page will contain a pointer to an updated dump when you read it.

After downloading and extracting it, we have around 37 GB of data in the XML format. This is illustrated in the following table:

File

Size (MB)

Description

badges.xml

309

Badges of users

comments.xml

3,225

Comments on questions or answers

posthistory.xml

18,370

Edit history

posts.xml

12,272

Questions and answers—this is what we need

users.xml

319

General information about users

votes.xml

2,200

Information on votes

As the files are more or less self-contained, we can delete all of them except posts.xml; it contains all the questions and answers as individual row tags within the root tag posts. Refer...

Creating our first classifier


Let us start with the simple and beautiful nearest neighbor method from the previous chapter. Although it is not as advanced as other methods, it is very powerful. As it is not model-based, it can learn nearly any data. However, this beauty comes with a clear disadvantage, which we will find out very soon.

Starting with the k-nearest neighbor (kNN) algorithm

This time, we won't implement it ourselves, but rather take it from the sklearn toolkit. There, the classifier resides in sklearn.neighbors. Let us start with a simple 2-nearest neighbor classifier:

>>> from sklearn import neighbors
>>> knn = neighbors.KNeighborsClassifier(n_neighbors=2)
>>> print(knn)
KNeighborsClassifier(algorithm=auto, leaf_size=30, n_neighbors=2, p=2, warn_on_equidistant=True, weights=uniform)

It provides the same interface as all the other estimators in sklearn. We train it using fit(), after which we can predict the classes of new data instances using predict...

Deciding how to improve


To improve on this, we basically have the following options:

  • Add more data: It may be that there is just not enough data for the learning algorithm and that we simply need to add more training data.

  • Play with the model complexity: It may be that the model is not complex enough or is already too complex. In this case, we could either decrease k so that it would take less nearest neighbors into account and thus would be better at predicting non-smooth data, or we could increase it to achieve the opposite.

  • Modify the feature space: It may be that we do not have the right set of features. We could, for example, change the scale of our current features or design even more new features. Or rather, we could remove some of our current features in case some features are aliasing others.

  • Change the model: It may be that kNN is generally not a good fit for our use case, such that it will never be capable of achieving good prediction performance no matter how complex we allow...

Using logistic regression


Contrary to its name, logistic regression is a classification method, and is very powerful when it comes to text-based classification. It achieves this by first performing regression on a logistic function, hence the name.

A bit of math with a small example

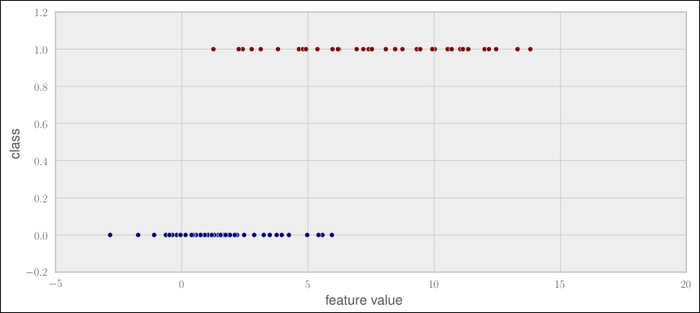
To get an initial understanding of the way logistic regression works, let us first take a look at the following example, where we have an artificial feature value at the X axis plotted with the corresponding class range, either 0 or 1. As we can see, the data is so noisy that classes overlap in the feature value range between 1 and 6. Therefore, it is better to not directly model the discrete classes, but rather the probability that a feature value belongs to class 1, P(X). Once we possess such a model, we could then predict class 1 if P(X) > 0.5 or class 0 otherwise:

Mathematically, it is always difficult to model something that has a finite range, as is the case here with our discrete labels 0 and 1. We can...

Looking behind accuracy – precision and recall


Let us step back and think again what we are trying to achieve here. Actually, we do not need a classifier that perfectly predicts good and bad answers, as we measured it until now using accuracy. If we can tune the classifier to be particularly good in predicting one class, we could adapt the feedback to the user accordingly. If we had a classifier, for example, that was always right when it predicted an answer to be bad, we would give no feedback until the classifier detected the answer to be bad. Contrariwise, if the classifier succeeded in predicting answers to be always good, we could show helpful comments to the user at the beginning and remove them when the classifier said that the answer is a good one.

To find out which situation we are in here, we have to understand how to measure precision and recall. To understand this, we have to look into the four distinct classification results as they are described in the following table:

Slimming the classifier


It is always worth looking at the actual contributions of the individual features. For logistic regression, we can directly take the learned coefficients (clf.coef_) to get an impression of the feature's impact. The higher the coefficient of a feature is, the more the feature plays a role in determining whether the post is good or not. Consequently, negative coefficients tell us that the higher values for the corresponding features indicate a stronger signal for the post to be classified as bad:

We see that LinkCount and NumExclams have the biggest impact on the overall classification decision, while NumImages and AvgSentLen play a rather minor role. While the feature importance overall makes sense intuitively, it is surprising that NumImages is basically ignored. Normally, answers containing images are always rated high. In reality, however, answers very rarely have images. So although in principal it is a very powerful feature, it is too sparse to be of any value...

Ship it!


Let's assume we want to integrate this classifier into our site. What we definitely do not want is to train the classifier each time we start the classification service. Instead, we can simply serialize the classifier after training and then deserialize it on that site:

>>> import pickle
>>> pickle.dump(clf, open("logreg.dat", "w"))
>>> clf = pickle.load(open("logreg.dat", "r"))

Congratulations, the classifier is now ready to be used as if it had just been trained.

Summary


We made it! For a very noisy dataset, we built a classifier that suits part of our goal. Of course, we had to be pragmatic and adapt our initial goal to what was achievable. But on the way, we learned about the strengths and weaknesses of the nearest neighbor and logistic regression algorithms. We learned how to extract features, such as LinkCount, NumTextTokens, NumCodeLines, AvgSentLen, AvgWordLen, NumAllCaps, NumExclams, and NumImages, and how to analyze their impact on the classifier's performance.

But what is even more valuable is that we learned an informed way of how to debug badly performing classifiers. This will help us in the future to come up with usable systems much faster.

After having looked into the nearest neighbor and logistic regression algorithms, in the next chapter we will get familiar with yet another simple yet powerful classification algorithm: Naive Bayes. Along the way, we will also learn how to use some more convenient tools from Scikit-learn.

lock icon The rest of the chapter is locked
You have been reading a chapter from
Building Machine Learning Systems with Python
Published in: Jul 2013 Publisher: Packt ISBN-13: 9781782161400
Register for a free Packt account to unlock a world of extra content!
A free Packt account unlocks extra newsletters, articles, discounted offers, and much more. Start advancing your knowledge today.
Unlock this book and the full library FREE for 7 days
Get unlimited access to 7000+ expert-authored eBooks and videos courses covering every tech area you can think of
Renews at $15.99/month. Cancel anytime}
  

Classified...