


 Download code from GitHub
Pentaho Data Integration (PDI) is an engine along with a suite of tools responsible for the processes of Extracting, Transforming, and Loading (also known as ETL processes). This book is meant to teach you how to use PDI.
In this chapter, you will:
- Learn what Pentaho Data Integration is
- Install the software and start working with the PDI graphical designer (Spoon)
- Explore the Spoon interface
- Set up your environment by installing other useful related software
Before introducing PDI, let's talk about Pentaho BI Suite. The Pentaho Business Intelligence Suite is a collection of software applications intended to create and deliver solutions for decision making. The main functional areas covered by the suite are:
- Analysis: The analysis engine serves multidimensional analysis. It's provided by the Mondrian OLAP server.
- Reporting: The reporting engine allows designing, creating, and distributing reports in various known formats (HTML, PDF, and so on), from different kinds of sources. In the Enterprise Edition of Pentaho, you can also generate interactive reports.
- Data mining: Data mining is used for running data through algorithms in order to understand the business and do predictive analysis. Data mining is possible thanks to Weka project.
- Dashboards: Dashboards are used to monitor and analyze Key Performance Indicators (KPIs). CTools is a set of tools and components created to help the user to build custom dashboards on top of Pentaho. There are specific CTools for different purposes, including a Community Dashboard Editor (CDE), a very powerful charting library (CCC), and a plugin for accessing data with great flexibility (CDA), among others. While the Ctools allow to develop advanced and custom dashboards, there is a Dashboard Designer, available only in Pentaho Enterprise Edition, that allows to build dashboards in an easy way.
- Data integration: Data integration is used to integrate scattered information from different sources (for example, applications, databases, and files) and make the integrated information available to the final user. PDI—the tool that we will learn to use throughout the book—is the engine that provides this functionality. PDI also interacts with the rest of the tools, as, for example, reading OLAP cubes, generating Pentaho Reports, and doing data mining with R Executor Script and the CPython Script Executor.
All of these tools can be used standalone but also integrated. Pentaho tightly couples data integration with analytics in a modern platform: the PDI and Business Analytics Platform. This solution offers critical services, for example:
- Authentication and authorization
- Scheduling
- Security
- Web services
- Scalability and failover
This set of software and services forms a complete BI Suite, which makes Pentaho the world's leading open source BI option on the market.
Note
You can find out more about the of the platform at https://community.hds.com/community/products-and-solutions/pentaho/. There is also an Enterprise Edition with additional features and support. You can find more on this at http://www.pentaho.com/.
Most of the Pentaho engines, including the engines mentioned earlier, were created as community projects and later adopted by Pentaho. The PDI engine is not an exception; Pentaho Data Integration is the new denomination for the business intelligence tool born as Kettle.
Note
The name Kettle didn't come from the recursive acronym Kettle Extraction, Transportation, Transformation, and Loading Environment it has now. It came from KDE Extraction, Transportation, Transformation and Loading Environment, since the tool was planned to be written on top of KDE, a Linux desktop environment.
In April 2006, the Kettle project was acquired by the Pentaho Corporation, and Matt Casters, the Kettle founder, also joined the Pentaho team as a data integration architect.
When Pentaho announced the acquisition, James Dixon, the Chief Technology Officer, said:
We reviewed many alternatives for open source data integration, and Kettle clearly had the best architecture, richest functionality, and most mature user interface. The open architecture and superior technology of the Pentaho BI Platform and Kettle allowed us to deliver integration in only a few days, and make that integration available to the community.
By joining forces with Pentaho, Kettle benefited from a huge developer community, as well as from a company that would support the future of the project.
From that moment, the tool has grown with no pause. Every few months a new release is available, bringing to the user's improvements in performance and existing functionality, new functionality, and ease of use, along with great changes in look and feel. The following is a timeline of the major events related to PDI since its acquisition by Pentaho:
- June 2006: PDI 2.3 was released. Numerous developers had joined the project and there were bug fixes provided by people in various regions of the world. The version included, among other changes, enhancements for large-scale environments and multilingual capabilities.
- November 2007: PDI 3.0 emerged totally redesigned. Its major library changed to gain massive performance improvements. The look and feel had also changed completely.
- April 2009: PDI 3.2 was released with a really large amount of changes for a minor version: new functionality, visualization and performance improvements, and a huge amount of bug fixes.
- June 2010: PDI 4.0 was released, delivering mostly improvements with regard to enterprise features, for example, version control. In the community version, the focus was on several visual improvements.
- November 2013: PDI 5.0 was released, offering better previewing of data, easier looping, a lot of big data improvements, an improved plugin marketplace, and hundreds of bug fixes and features enhancements, as in all releases. In its Enterprise version, it offered interesting low-level features, such as step load balancing, Job transactions, and restartability.
- December 2015: PDI 6.0 was released with new features such as data services, data lineage, bigger support for Big Data, and several changes in the graphical designer for improving the PDI user experience. Some months later, PDI 6.1 was released including metadatainjection, a feature that enables the user to modify Transformations at runtime. Metadata injection had been available in earlier versions, but it was in 6.1 that Pentaho started to put in a big effort in implementing this powerful feature.
- November 2016: PDI 7.0 emerged with many improvements in the enterprise version, including data inspection capabilities, more support for Big Data technologies, and improved repository management. In the community version, the main change was an expanded metadata injection support.
- November 2017: Pentaho 8.0 is released. The highlights of this latest version are the optimization of processing resources, a better user experience, and the enhancement of the connectivity to streaming data sources—real-time processing.
Paying attention to its name, Pentaho Data Integration, you could think of PDI as a tool to integrate data.
In fact, PDI does not only serve as a data integrator or an ETL tool. PDI is such a powerful tool that it is common to see it being used for these and for many other purposes. Here you have some examples.
The loading of a data warehouse or a data mart involves many steps, and there are many variants depending on business area or business rules.
However, in every case, with no exception, the process involves the following steps:
- Extracting information from one or more databases, text files, XML files, and other sources. The extract process may include the task of validating and discarding data that doesn't match expected patterns or rules.
- Transforming the obtained data to meet the business and technical needs required on the target. Transforming includes such tasks such as converting data types, doing some calculations, filtering irrelevant data, and summarizing.
- Loading the transformed data into the target database or file store. Depending on the requirements, the loading may overwrite the existing information or may add new information each time it is executed.
Kettle comes ready to do every stage of this loading process. The following screenshot shows a simple ETL designed with the tool:
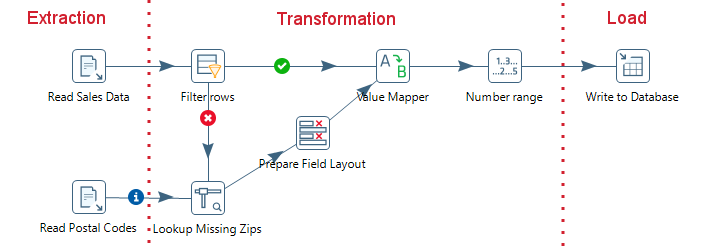
ETL process
Imagine two similar companies that need to merge their databases in order to have a unified view of the data, or a single company that has to combine information from a main Enterprise Resource Planning (ERP) application and a Customer Relationship Management (CRM) application, though they're not connected. These are just two of hundreds of examples where data integration is needed. The integration is not just a matter of gathering and mixing data; some conversions, validation, and transfer of data have to be done. PDI is meant to do all these tasks.
Data cleansing is about ensuring that the data is correct and precise. This can be achieved by verifying if the data meets certain rules, discarding or correcting those which don't follow the expected pattern, setting default values for missing data, eliminating information that is duplicated, normalizing data to conform to minimum and maximum values, and so on. These are tasks that Kettle makes possible, thanks to its vast set of transformation and validation capabilities.
Think of a company, any size, which uses a commercial ERP application. One day the owners realize that the licenses are consuming an important share of its budget. So they decide to migrate to an open source ERP. The company will no longer have to pay licenses, but if they want to change, they will have to migrate the information. Obviously, it is not an option to start from scratch or type the information by hand. Kettle makes the migration possible, thanks to its ability to interact with most kind of sources and destinations, such as plain files, commercial and free databases, and spreadsheets, among others.
Data may need to be exported for numerous reasons:
- To create detailed business reports
- To allow communication between different departments within the same company
- To deliver data from your legacy systems to obey government regulations, and so on
Kettle has the power to take raw data from the source and generate these kinds of ad hoc reports.
The previous examples show typical uses of PDI as a standalone application. However, Kettle may be used embedded as part of a process or a data flow. Some examples are preprocessing data for an online report, sending emails in a scheduled fashion, generating spreadsheet reports, feeding a dashboard with data coming from web services, and so on.
Note
The use of PDI integrated with other tools is beyond the scope of this book. If you are interested, you can find more information on this subject in the Pentaho Data Integration Cookbook - Second Edition by Packt Publishing at https://www.packtpub.com/big-data-and-business-intelligence/pentaho-data-integration-cookbook-second-edition.
In order to work with PDI, you need to install the software.
Note
The only prerequisite to install the tool is to have JRE 8.0 installed. If you don't have it, download it from www.javasoft.com and install it before proceeding.
Following are the instructions to install the PDI software, irrespective of the operating system you may be using:
- Go to the
Downloadpage at http://sourceforge.net/projects/pentaho/files/Data Integration.
- Choose the newest stable release. At this time, it is 8.0, as shown in the following screenshot:
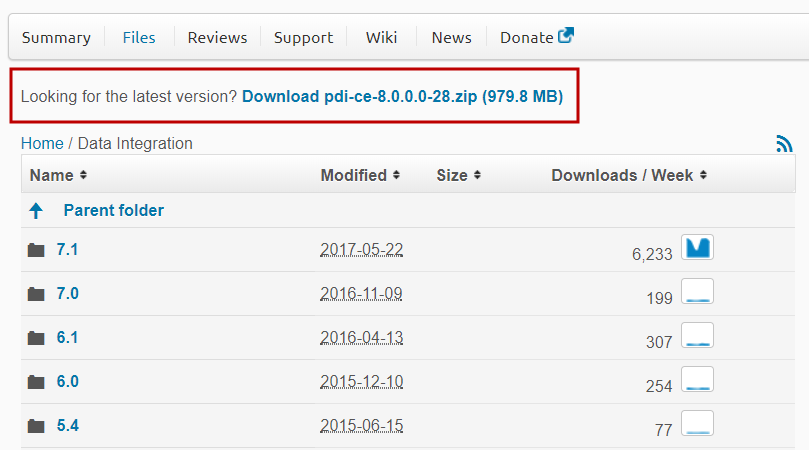
PDI on SourceForge.net
- Download the available
zipfile, which will serve you for all platforms.
- Unzip the downloaded file in a folder of your choice, as, for example,
c:/util/kettleor/home/pdi_user/kettle.
And that's all. You have installed the tool in just a few minutes.
Note
The version of PDI that you just installed corresponds to the Community Edition (CE) of the tool. The book, however, can be also used for learning to use the Enterprise Edition (EE). Excepting for minor differences if you work with repositories, most of the examples in the book should work without changes. Also, if for any reason you have to use a previous version of PDI, the good news are that most of the content explained here also applies to PDI 6 and PDI 7.
Now that you've installed PDI, you're ready to start working with the data. That will be possible only inside a graphical environment. PDI has a desktop designer tool named Spoon. Let's launch Spoon and see what it looks like.
Spoon is PDI's desktop design tool. With Spoon, you design, preview, and test all your work, that is, transformations and jobs. When you see PDI screenshots, what you are really seeing are Spoon screenshots. The other PDI components, which you will learn about in the following chapters, are executed from Terminal windows.
Here is how you launch the tool:
- Start Spoon. If your system is Windows, run
Spoon.batfrom within the PDI install directory. In other platforms, such as Unix, Linux, and so on, open a Terminal window and typespoon.sh. - The main window shows up. The
Welcome!window appears with some useful links for you to see:
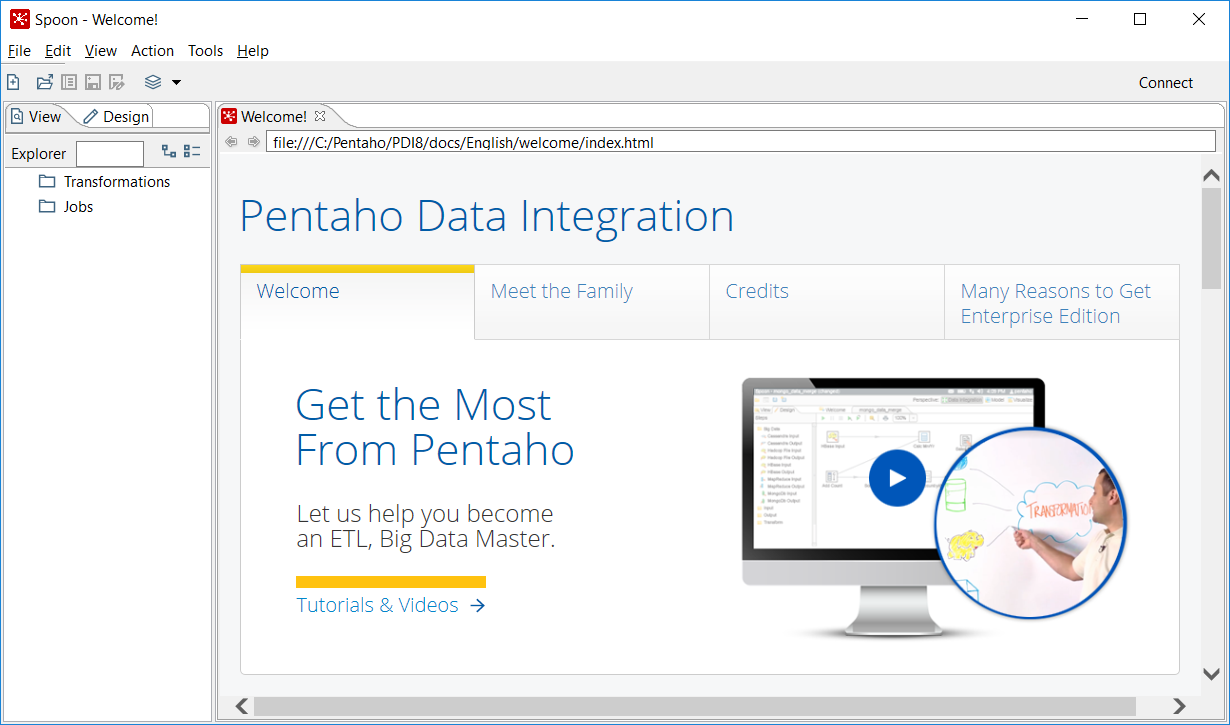
Welcome page
Note
If Spoon doesn't start as expected, launch SpoonDebug.bat (or .sh) instead. This utility starts Spoon with a console output and gives you the option to redirect the output to a file. By inspecting this output, you will be able to find out what happened and fix the issue.
These simple steps would be enough to start working, but before that, it's advisable to customize Spoon to your needs. For doing that:
- Click on
Options...from theToolsmenu. A window appears where you can change various general and visual characteristics. Uncheck the highlighted checkbox, as shown in the following screenshot:
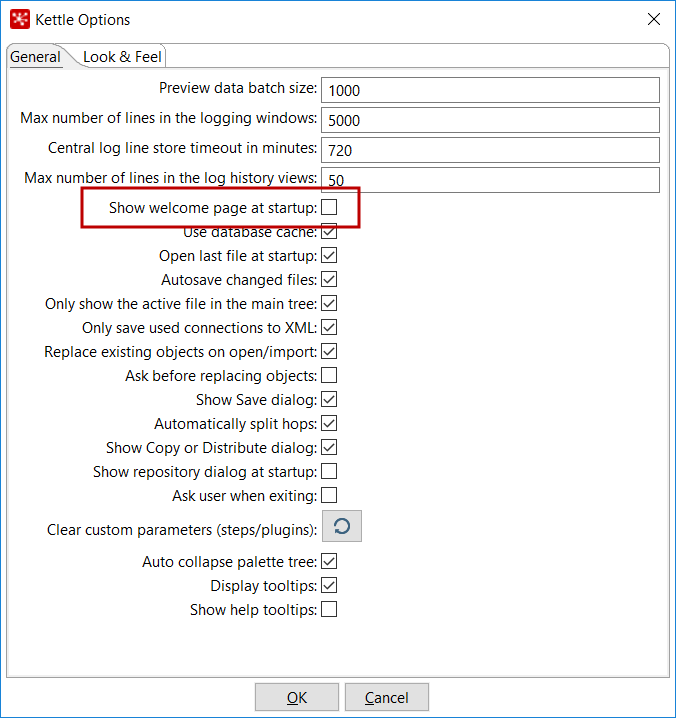
Kettle options
- Select the tab window
Look & Feel.
- Change the
Font for notes,Show Canvas Grid, andPreferred Languagesettings as shown in the following screenshot:
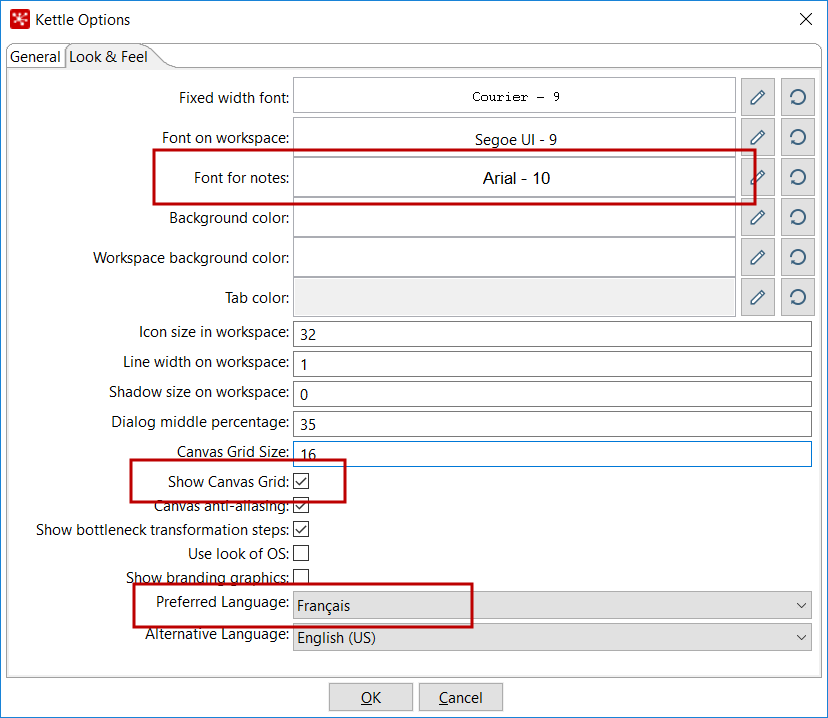
Look and Feel options
- Click on the
OKbutton.
- Restart Spoon in order to apply the changes. You should not see the
Welcome!window. You should see the following screenshot full of French words instead:
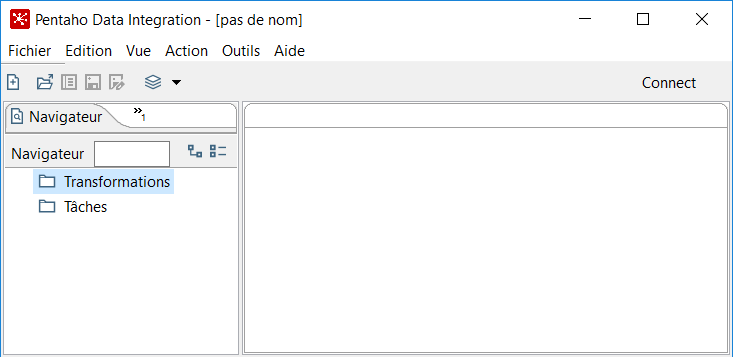
French as preferred language
As you can see, the Options window has a lot of settings. We changed only a few, just to show the feature. Feel free to change the settings according to your needs or preferences.
In particular, take note of the following tip about the selected language.
Note
If you choose a preferred language other than English, you should select a different language as an alternative. If you do so, every name or description not translated to your preferred language will be shown in the alternative language.
One of the settings that you changed was the appearance of the Welcome! window at startup. The Welcome! page is full of links to web resources, blogs, forums, books on PDI, and more. Following those links, you will be able to learn more and become active in the Pentaho community. You can reach that window anytime by navigating to the Help | Welcome Screen option.
Note
The Welcome! page redirects you to the forum at https://forums.pentaho.com/forumdisplay.php?135-Data-Integration-Kettle. Since November 2017 there is a new collaboration space. You can reach the PDI space at https://community.hds.com/community/products-and-solutions/pentaho/data-integration.
As explained earlier, Spoon is the tool with which you create, preview, and run transformations. The following screenshot shows you the basic work areas: Main Menu, Main Toolbar, Steps Tree, Transformation Toolbar, and Canvas (Work Area). Note that there is a sample Transformation opened; it allows you to see how the tool looks when you are working with it:
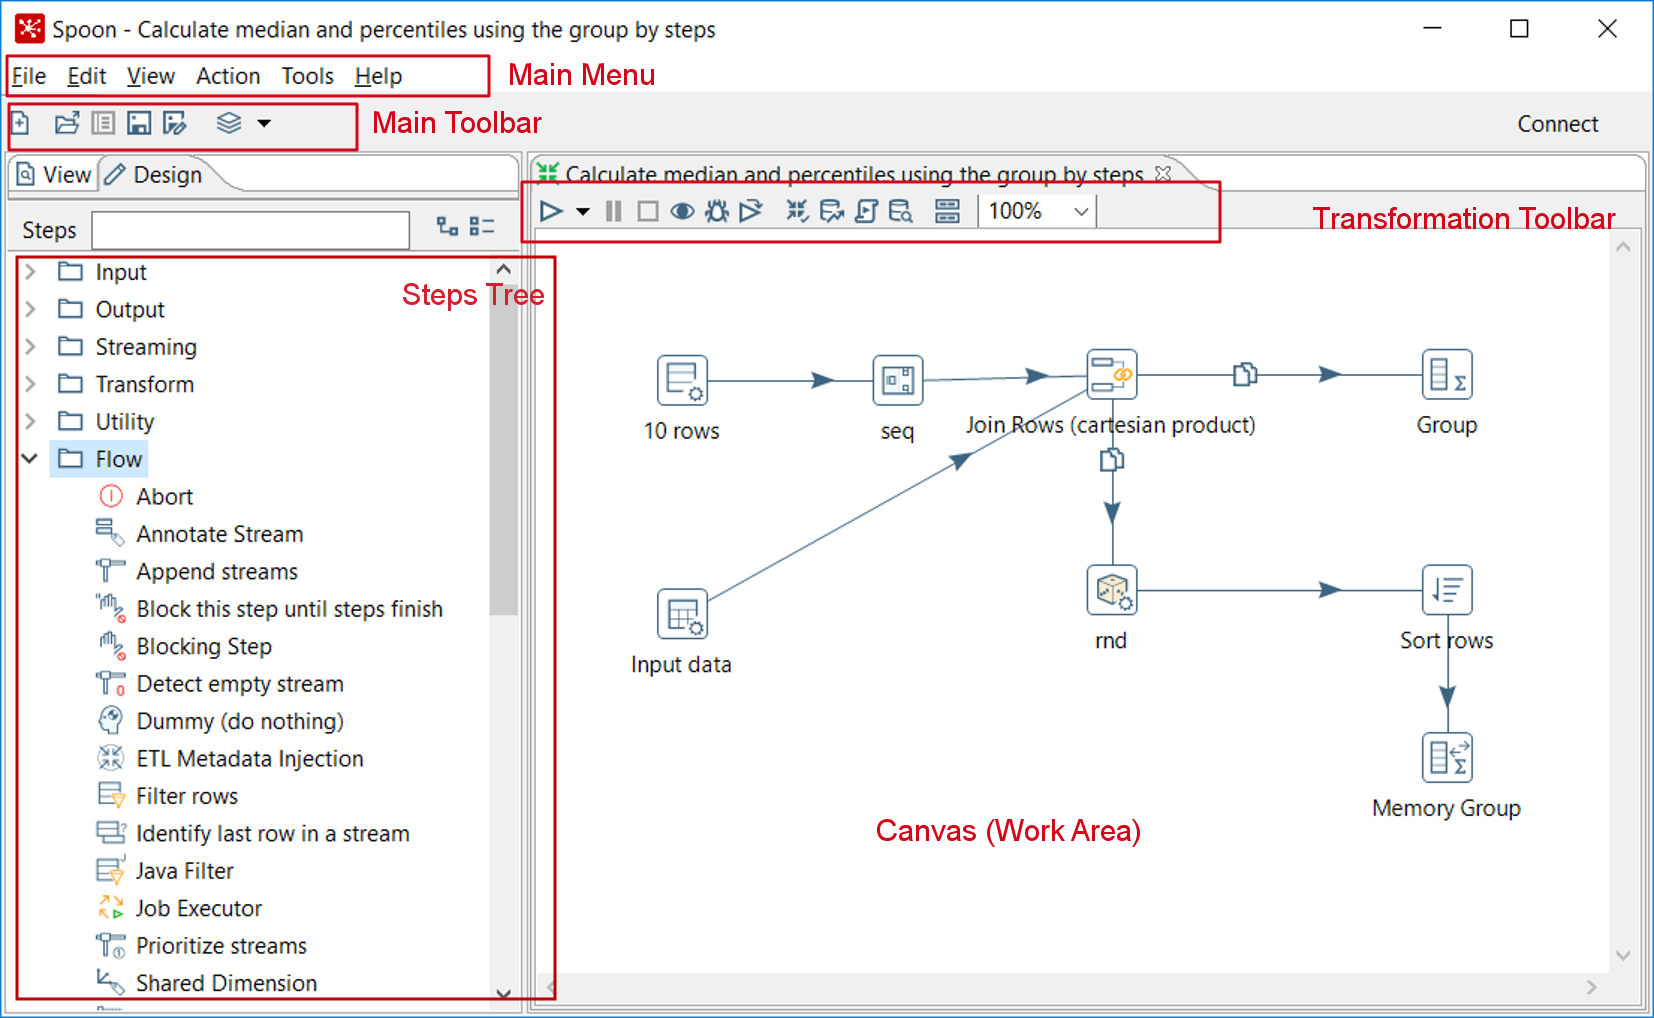
Spoon interface
The Steps Tree option is only available in Design view. There is also an area named View that shows the structure of the Transformation currently being edited. You can see that area by clicking on the View tab at the upper-left corner of the screen:
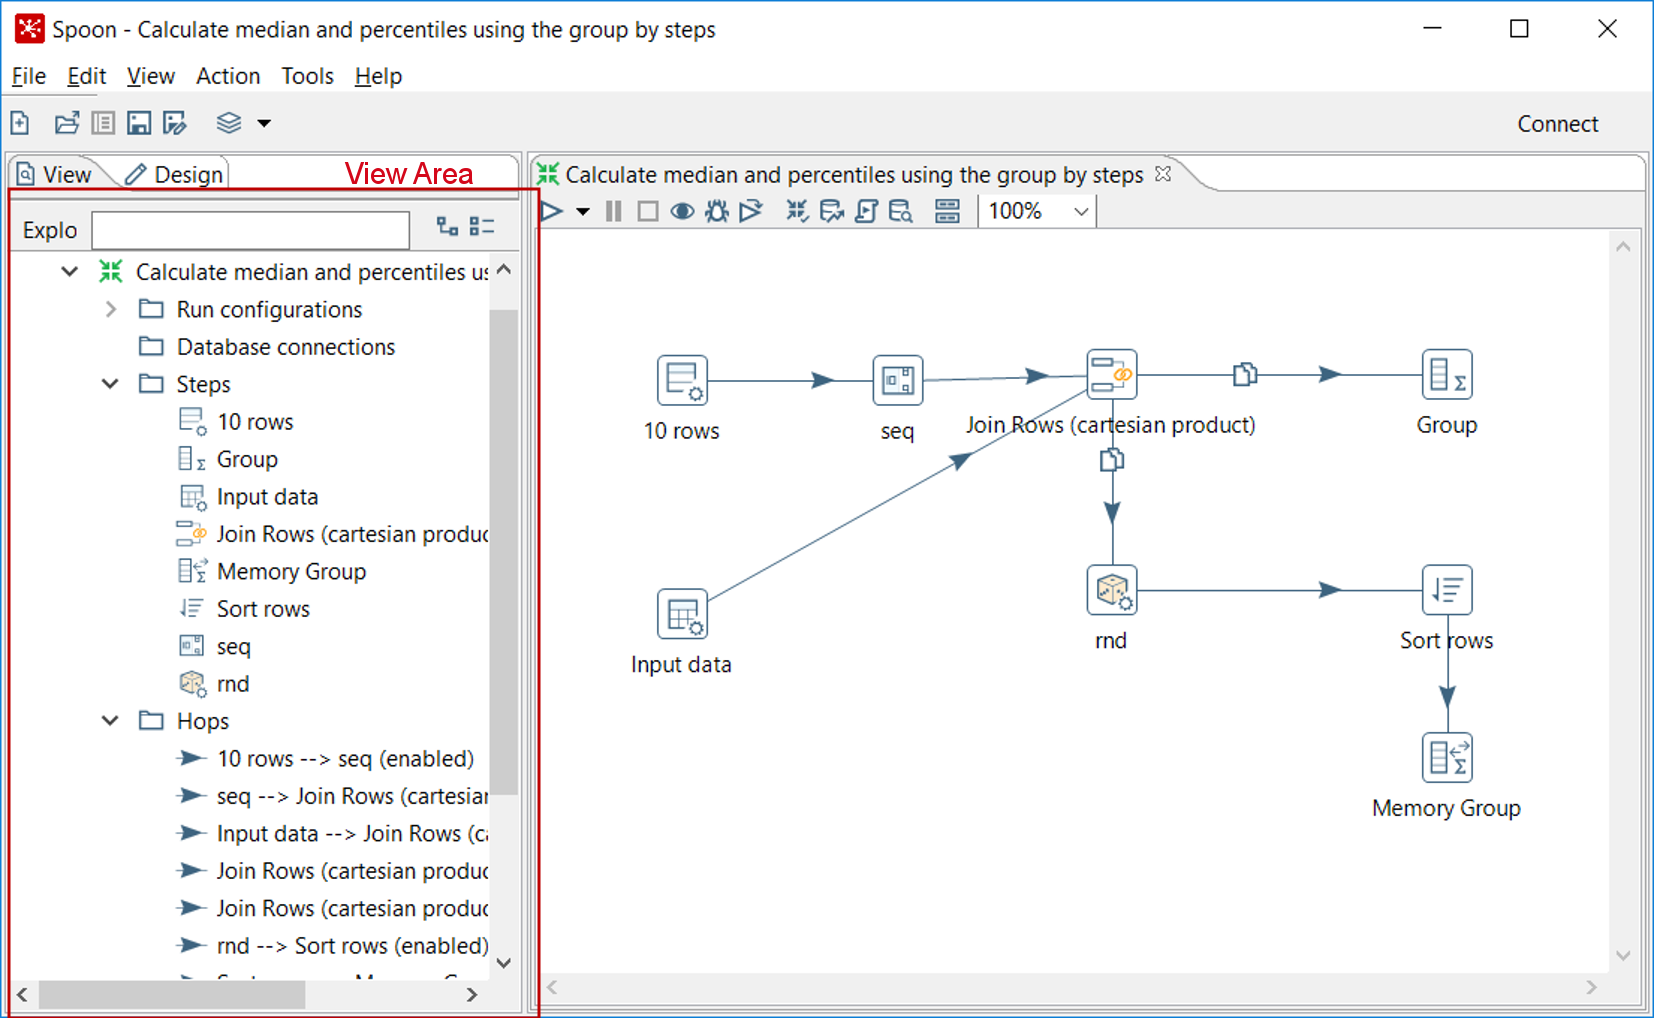
Spoon view area
Pentaho Data Integration is built on a pluggable architecture. This means that it can be extended to fulfill needs not included out of the box. The Marketplace—a plugin itself—emerged as a straightforward way for browsing and installing available plugins, developed by the community or even by Pentaho.
In PDI, you will find plugins for connecting to a particular database engine, for executing scripts, for transforming data in new ways, and more. According to the purpose, the plugins are classified into several types: big data, connectivity, and statistics, among others. In particular, there is a type named Experimental, which you will not use except for playing around. There is another type named Deprecated, which we don't recommend you use unless you need it for back compatibility.
An important point to highlight about plugins is the maturity stage. The maturity classification model consists of two parallel lanes:
- CommunityLane: For Community and customer-sponsored projects.
- CustomerLane: For projects which are part of the official Pentaho offering. Projects in the Customer Lane can start as projects developed in the Community Lane that create value for Pentaho subscription customers.
There are four stages in each lane. To put it simply, stage 1 means that the plugin is under development (it is usually a lab experiment), while stage 4 indicates a mature state; a plugin in stage 4 is successfully adopted and could be used in production environments. Stages 2 and 3 are stages in between these two.
Note
For a full explanation of the model and the maturity stages, you can refer to https://community.hds.com/docs/DOC-1009876.
That said, let's go back to Spoon. You can access the Marketplace page by clicking on Marketplace from the Tools menu. The page is quite simple, as shown in the following screenshot:
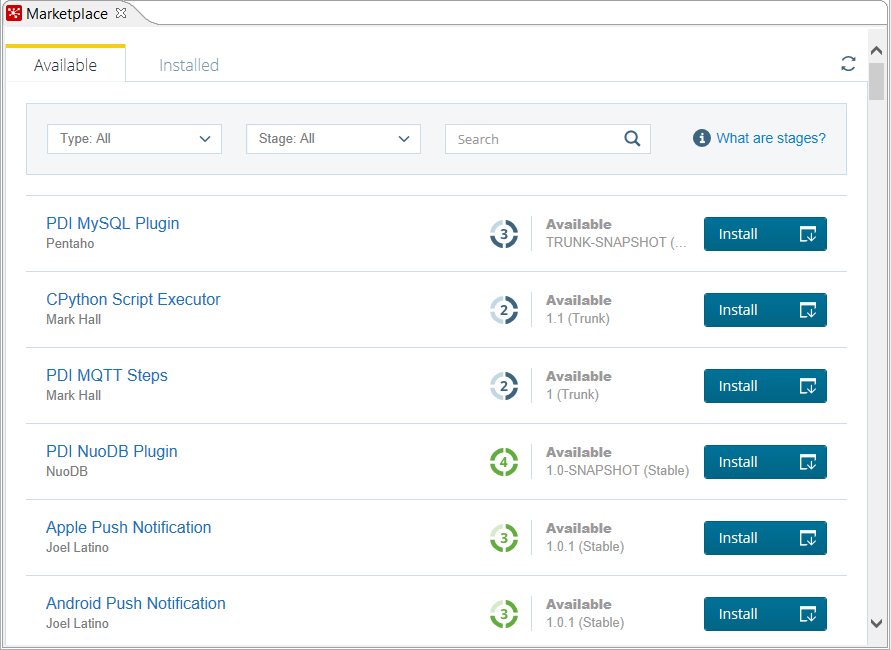
Marketplace
By default, you see the list of all the Available/Installed plugins. There is a secondary tab where you can filter just the installed ones.
Also, you can filter by plugin Type and by maturity Stage. And if you are looking for a particular plugin, there is also a Search textbox available.
Once in the Marketplace page, for every plugin you can see:
- The name
- The author
- The maturity stage
- The status:
AvailableorInstalled - The branch and version
- A button for installing the plugin or a check telling that the plugin is already installed
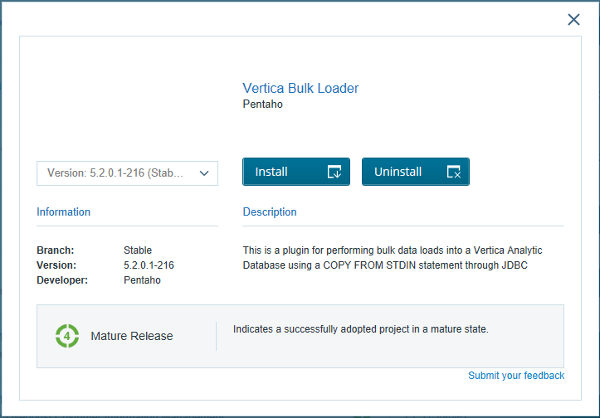
If you click on the plugin name, a pop-up window shows up displaying the full description for the selected plugin, as shown in the following example:
Sample plugin in Marketplace
Besides browsing the list of plugins, you can install or uninstall them:
- In order to install a plugin, there is an
Installbutton in the plugin list and also in the pop-up window - If the plugin is already installed, the pop-up window will also offer the option for uninstalling it, as in the previous example
Note
Note that some plugins are only available in Pentaho Enterprise Edition. For a particular plugin, you can find this information as part of its full description.
It's premature to decide if you need to install a plugin for your work. So let's put this subject aside for a while; we will get back to this feature later in the book.
Till now, you've just opened and customized the look and feel of Spoon. It's time to do some interesting tasks beyond looking around. As mentioned before, in PDI we basically work with two kinds of artifacts: transformations and jobs. In this section, we will introduce transformations. First of all, we will introduce some basic definitions. Then, we will design, preview, and run our first Transformation.
A Transformation is an entity made of steps linked by hops. These steps and hops build paths through which data flows: the data enters or is created in a step, the step applies some kind of Transformation to it, and finally, the data leaves that step. Therefore, it's said that a Transformation is data flow oriented. Graphically, steps are represented with small boxes, while hops are represented by directional arrows, as depicted in the following sample:
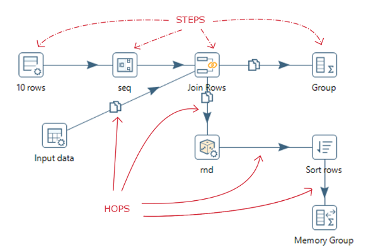
Steps and hops
A Transformation itself is neither a program nor an executable file. It is just plain XML. The Transformation contains metadata, which tells the Kettle engine what to do.
A step is a minimal unit inside a Transformation. A big set of steps is available, either out of the box or the Marketplace, as explained before. These steps are grouped in categories, as, for example, input, output, or transform. Each step is conceived to accomplish a specific function, going from a simple task as reading a parameter to normalizing a dataset.
A hop is a graphical representation of data flowing between two steps: an origin and a destination. The data that flows through that hop constitutes the output data of the origin step and the input data of the destination step.
That's enough theory for now. Let's see it in practice.
In this section, we will design, preview, and run a simple Hello World! Transformation; simple, but good enough for our first practical example.
Here are the steps to start working on our very first Transformation. All you need for starting is to have PDI installed:
- Open Spoon.From the main menu and navigate to
File|New|Transformation. - On the left of the screen, under the
Designtab, you'll see a tree ofSteps. Expand theInputbranch by double-clicking on it.
- Then, left-click on the
Data Gridicon and without releasing the button, drag and drop the selected icon to the main canvas. The screen will look like the following screenshot:
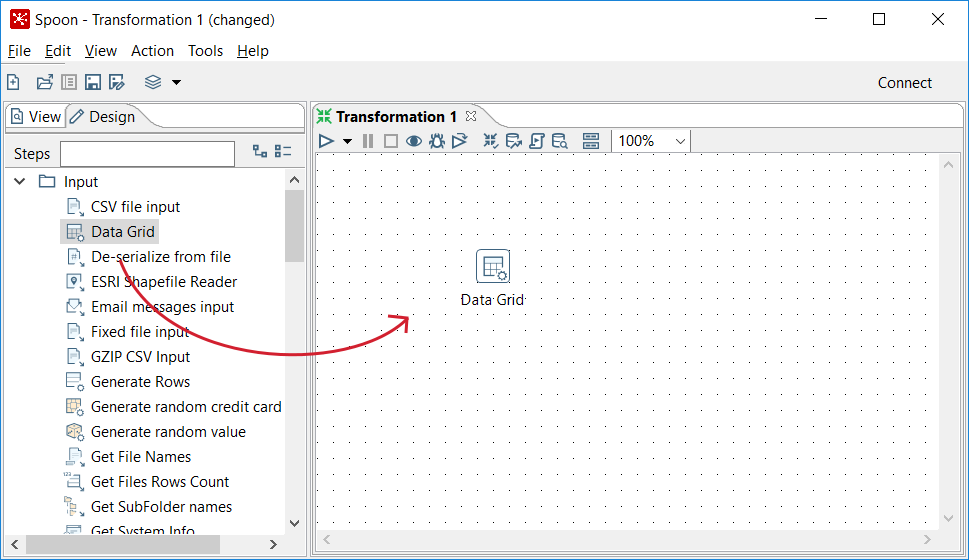
Dragging and dropping a step
Note
The dotted grid appeared as a consequence of the changes we made in the options window. Also, note that we changed the preferred language back to English.
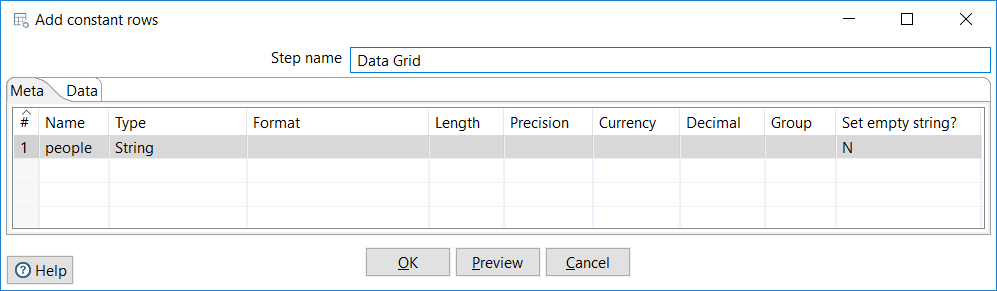
- Double-click on the
Data Gridstep you just put on the canvas, and fill theMetatab as follows:
Configuring a metadata tab
- Now select the
Datatab and fill the grid with some names, as in the following screenshot. Then click onOKto close the window:
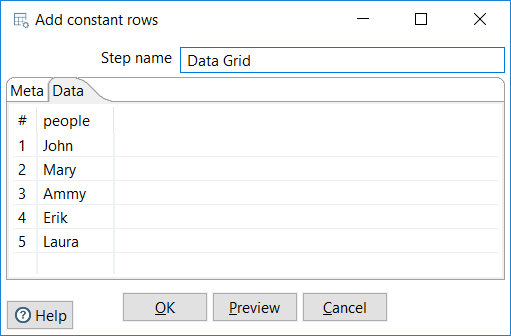
Filling a Data tab
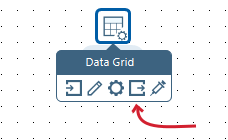
- From the Steps tree, double-click on the
Scriptingbranch, click on theUser Defined Java Expressionicon, and drag and drop it to the main canvas. - Put the mouse cursor over the
Data Gridstep and wait until a tiny toolbar shows up succeeding theData Gridicon, as shown next:
Mouseover assistance toolbar
- Click on the output connector (the icon highlighted in the preceding image) and drag it towards the
User Defined Java Expression(UDJE) step. A greyed hop is displayed.
- When the mouse cursor is over the
UDJEstep, release the button. A link—a hop from now on is created from theData Gridstep to theUDJEstep. The screen should look like this:
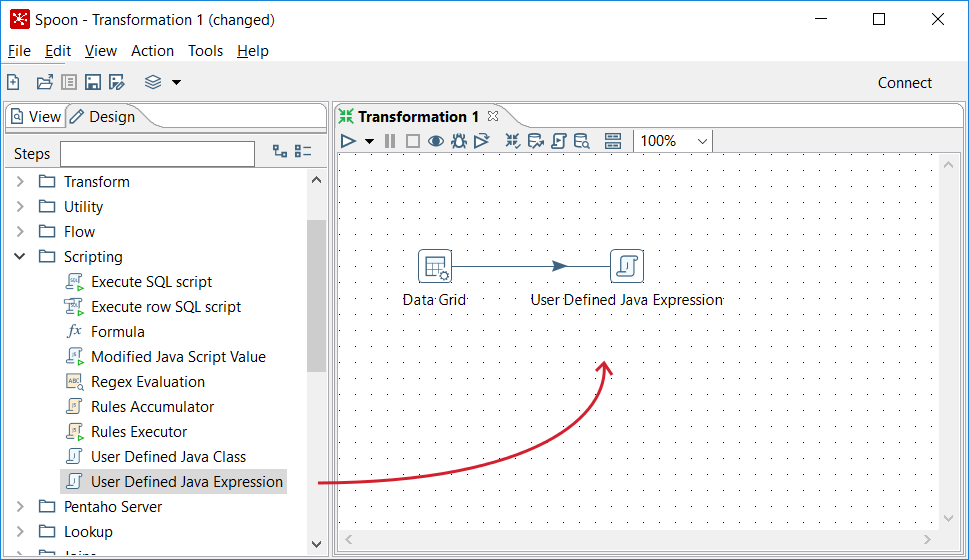
Connecting steps with a hop
- Double-click the
UDJEicon and fill the grid as shown. Then close the window:
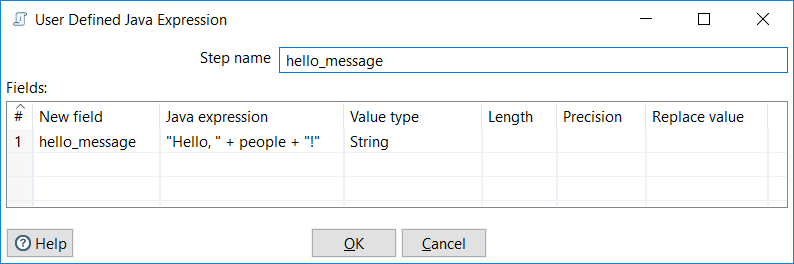
Configuring a UDJE step
Done! We have a draft for our first Transformation. A Data Grid with the names of a list of people, and a script step that builds the hello_message.
Before continuing, let's just add some color note to our work. This is totally optional, but as your work gets more complicated, it's highly recommended that you comment your transformations:
- Right-click anywhere on the canvas to bring a contextual menu.
- In the menu, select the
New noteoption. A note editor appears. - Type some description, such as
Hello, World!. Select theFont styletab and choose some nice font and colors for your note, and then click onOK. This should be the final result:
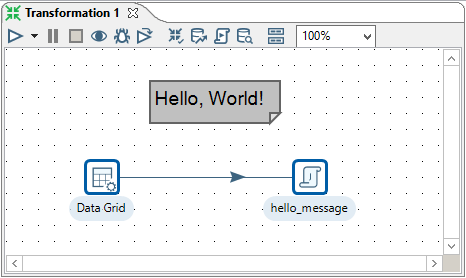
Hello World Transformation
The final step is to save the work:
- From the main menu, navigate to
Edit|Settings.... A window appears to specify Transformation properties. Fill theTransformation nametextbox with a simple name, such ashello world. Fill theDescriptiontextbox with a short description, such asMy first transformation. Finally, provide a more clear explanation in theExtended descriptiontextbox, and then click onOK.
- From the main menu, navigate to
File|Saveand save the Transformation in a folder of your choice with the namehello_world.
Next step is to preview the data produced and run the Transformation.
Now we will preview and run the Transformation created earlier. Note the difference between both:
- The Preview functionality allows you to see a sample of the data produced for selected steps
- The Run option effectively runs the whole Transformation
In our Transformation, we will preview the output of the User Defined Java Expression step:
- Select the
User Defined Java Expressionstep by left-clicking on it. - Click on the
Previewicon in the bar menu preceding in the main canvas:
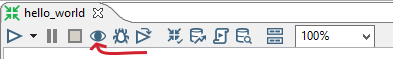
Preview icon in the Transformation toolbar
- The
Transformation debug dialogwindow will appear. Click on theQuick Launchbutton.
- A window will appear to preview the data generated by the Transformation, as shown in the following screenshot:
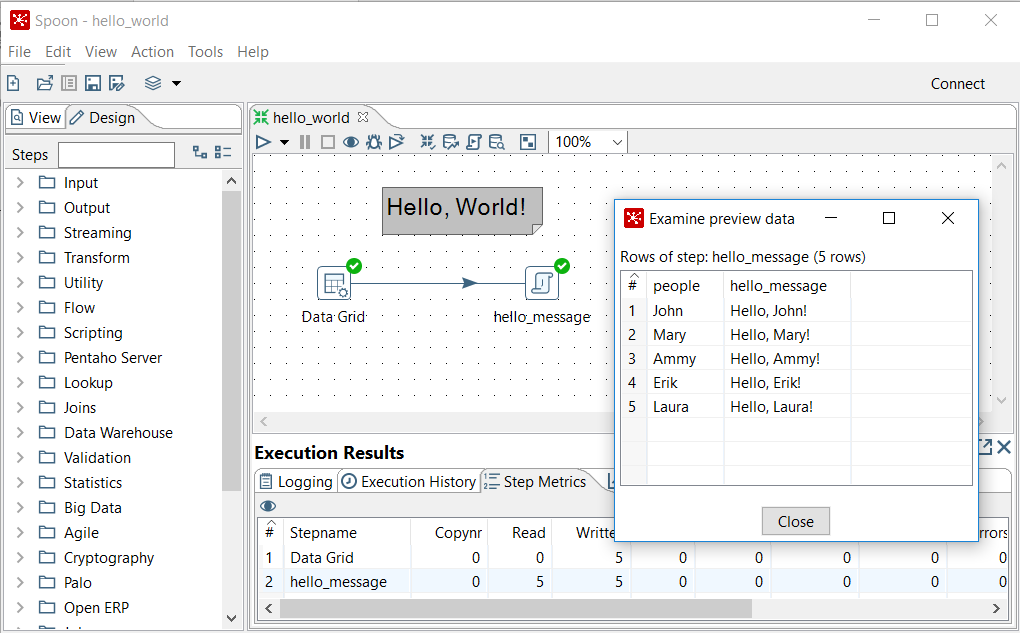
Previewing the Hello World Transformation
- Close the preview window.
Note
You can preview the output of any step in the Transformation at any time of your designing process. You can also preview the data even if you haven't yet saved the work.
Once we have the Transformation ready, we can run it:
- Click on the
Runicon:
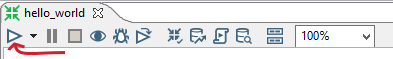
Run icon in the Transformation toolbar
- A window named
Run Optionsappears. Click onRun.
Note
You need to save the Transformation before you run it. If you have modified the Transformation without saving it, you will be prompted to do so.
- At the bottom of the screen, you should see a log with the result of the execution:
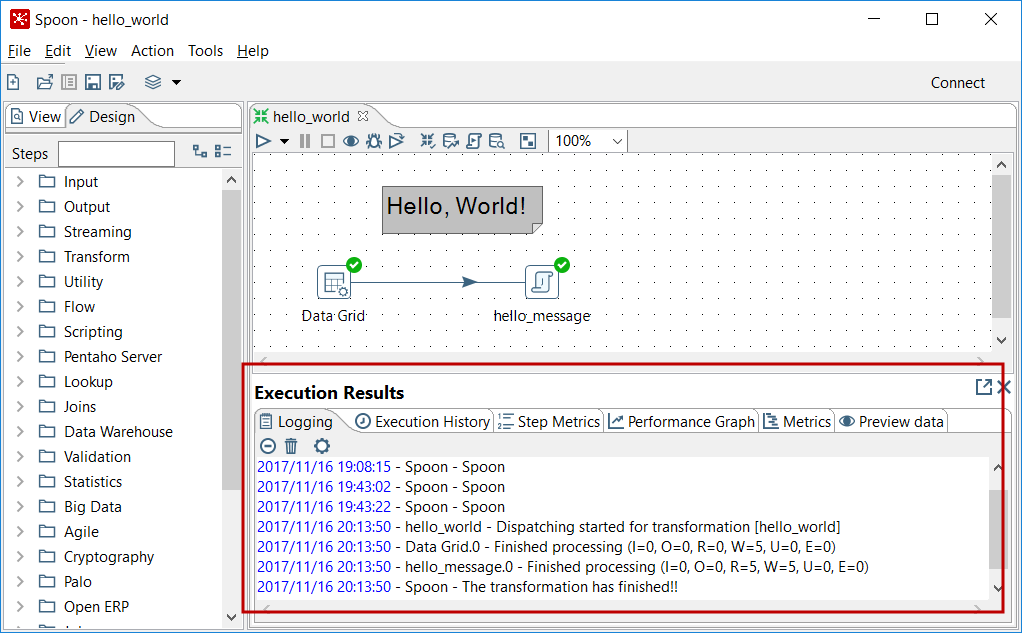
Sample execution results window
Whether you preview or run a Transformation, you'll get an Execution Results window showing what happened. You will learn more about this in Chapter 2, Getting Started with Transformations.
Before skipping to the next chapter, let's devote some time to the installation of extra software that will complement our work with PDI.
First of all, it is really important that you have a nice text editor. You will need it for preparing testing data, for reading files before ingesting them with PDI, for viewing data that comes out of transformations, and for reviewing logs. A couple of examples of good text editors are Notepad++ and Sublime Text.
You will be working with spreadsheets, so another useful software will be a spreadsheet editor, as, for example, OpenOffice Calc.
In Chapter 10, Performing Basic Operations with Databases, and Chapter 11, Loading Data Marts with PDI, you will work with databases. As PostgreSQL has become a very used and popular open source database, it was the database engine chosen for the database-related tutorials in this book. So, if you intend to work with databases from PDI, it will be necessary that you have access to a PostgreSQL database engine.
Also, it's recommended that you install some visual software that will allow you to administer and query the database. For PostgreSQL, you can install PgAdmin. Another option would be to install a generic open source tool, for example, SQuirrel SQL Client, a graphical program that allows you to work with PostgreSQL as well as with other database engines.
If you don't have access to a PostgreSQL server, it's fine to work with a different database engine, either commercial or open source. In some cases, you will have to slightly adapt the samples, but in general, you will be fine with the explanations of the book.
Finally, having an Internet connection while reading is extremely useful as well. Several links are provided throughout the book that complements to what is explained. Additionally, there is the PDI forum where you may search or post doubts if you are stuck with something.
In this chapter, you were introduced to Pentaho Data Integration. Specifically, you learned what PDI is and you installed the tool. You also were introduced to Spoon, the graphical designer tool of PDI, and created your first Transformation.
Now that you have learned the basics, you are ready to begin experimenting with transformations. That is the topic of the next chapter.